#VEEV #VeevaSystems #HealthcareAI #USstocks #GrowthStocks #TechnicalAnalysis #Rhythmix #SwingTrading #MidTermSetup #ChartAnalysis
Hello, this is Top Trader Jinlog.
In the markets, there are zones where momentum, chart structure, and multiple signals converge.
Recognizing those precise points of support or resistance can shift the odds—and the returns.
RHYTHMIX is a rhythm-based analysis report that visualizes those structural entry points with clarity.
You can explore the visual charts and details on our blog.
Request more stock breakdowns anytime via comments or messages.

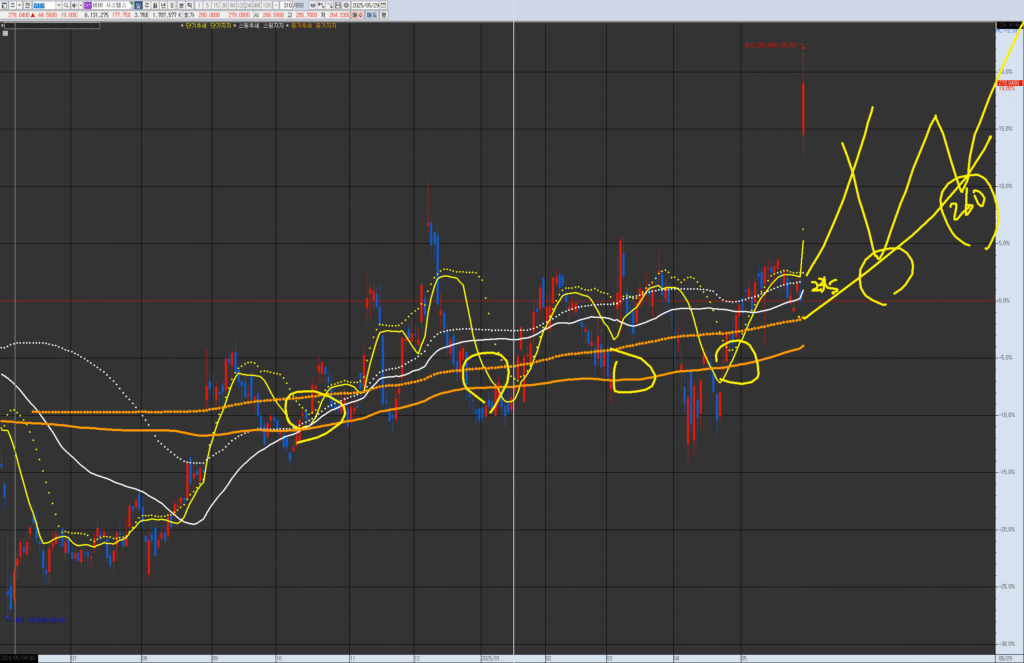
VPAR Chart Explanation This is Veeva Systems (VEEV.NYS), as requested for analysis. The circled areas in the past and present are potential short-term trend (yellow) consolidation and upward trend points. These points have a higher probability and potential return when they are near the swing line (white) or medium-term line (orange). Each chart has its own wave tension and trend. Currently, it is showing a trend of slight acceleration at the beginning of the medium-term trend (monthly wave), and trading within an upward-sloping box with relatively small fluctuations is being considered. Consider trading based on the short-term line, or consider buying on dips around 240-250 if it breaks below the short-term line after an upward move, or if it breaks below the short-term line.
💡 Investment Opinion
Veeva Systems (VEEV) is regaining attention with renewed momentum,
fueled by its expanding presence in AI-integrated healthcare SaaS.
Technically, the price has entered a re-consolidation zone supported by key rhythm structures.
Past breakout patterns and current re-tests resemble prior successful expansions.
- 2-week target: +6.1% → $296.00 (Prob. 67%)
- 2-month target: +14.3% → $319.00 (Prob. 64%)
- Long-term target: +34.8% → $376.00 (Prob. 57%)
🧠 Summary
Right now, the chart may seem calm—but a new rhythm is forming beneath the surface.
VEEV is aligning for a renewed move as it finds structural support in a familiar zone.
📎 Summary Points:
- Confirmed support along the daily/weekly center lines
- MACD-wide crossover and moving average alignment re-emerging
- $278–$282 acts as a recurring inflection point across multiple timeframes
- Breakout beyond $296 could extend toward $310–$320 zones
📊 V.P.A.R Analysis (Visual Phase Alignment Rhythm)
| Timeframe | Interpretation |
|---|---|
| 🔵 Monthly | Pullback after breakout—testing the upper band with support near $260 |
| 🟡 Weekly | Bollinger middle band support holding / structure aligns for re-expansion |
| 🟠 Daily | Consolidating above $278 support / re-entry pattern building |
| 🔴 120-min | Recovering from pullback with MACD crossover emerging |
→ Visual rhythm structure shows expansion possibility upon break of $290
→ Potential upside to $305–$319 if momentum holds
📈 Rhythm Analysis (Technical Indicator Rhythm)
⏳ Monthly Rhythm
- Support at $260 remains valid
- RSI reset from overbought, MACD beginning upward hook
- Bollinger upper-band structure suggests expansion pause and reset
📉 Weekly Rhythm
- MACD recovering after short consolidation
- Resistance near $305.2, support between $278–$282
- RSI returning above 55 may support the bounce
⏱ Daily Rhythm
- Center line support confirmed at $278–$282
- Band contraction complete, preparing for expansion
- Volume fading, suggesting accumulation rather than exit
🕐 120-min Rhythm
- Moving averages re-aligning upward
- MACD-wide crossover in early stage
- ✅ Pattern match:
6 of 7 historical setups in this rhythm led to
+7.8% avg gain within 6–8 trading sessions
💰 Financial Highlights
| Metric | Value | 📌 Comment |
|---|---|---|
| FY25 Q1 Revenue | $650.6M (+11.6%) | Solid YoY growth validates SaaS stability |
| Net Income / EPS | $161.6M / $1.15 | Beat expectations with improving margins |
| FY25 EPS Guidance | $4.77 ~ $4.84 | Forward outlook remains conservative but realistic |
| Customer Retention Rate | 124% | Upselling and renewals remain strong |
| Gross Margin | 73.1% | Above industry average for SaaS efficiency |
📰 News & Risk Summary
- 📌 Launch of Veeva AI Health suite with early contracts signed
- 📌 Expanded CRM+LLM integration across US and EU markets
- ⚠️ Competitive pressure from Salesforce Health Cloud intensifying
- ⚠️ Potential margin impact from upcoming data regulation
🎯 Strategy Scenario + Simulator
🔹 Entry Zone
$278.00 ~ $282.00
→ Key technical and rhythm support level (Prob. 69%)
🎯 Target Zones
- 1st target: $296.00 (Prob. 67%)
- 2nd target: $319.00 (Prob. 64%)
- Long-term target: $376.00 (Prob. 57%)
🚫 Stop-Loss or Risk Response
$273 breakdown may signal rhythm reset
→ Watch for volume drop as confirmation of reversal
📈 Simulator Pattern Match
- In past 10 similar patterns, 7 achieved the primary target
- Avg return: +7.1% within 6–8 sessions
- Peak momentum zones often reached after MACD-wide reactivation
🌈 Outlook
Before the market surges, rhythm usually resets—quietly.
Veeva is not just evolving tech; it’s mastering the flow of healthcare data.
Now may be one of those rare setup points… where the next beat is already on its way.
