#TempusAI #TEM #HealthcareTech #AIMomentum #RHYTHMIXReport
#BiotechStocks #AIStocks #PrecisionMedicine #BreakoutRhythm
Hello, this is Top Trader Jinlog.
You can explore the full chart and content on the blog.
If you want consistent analysis, feel free to subscribe or leave a comment.
To receive this report faster, choose the Priority Review option.

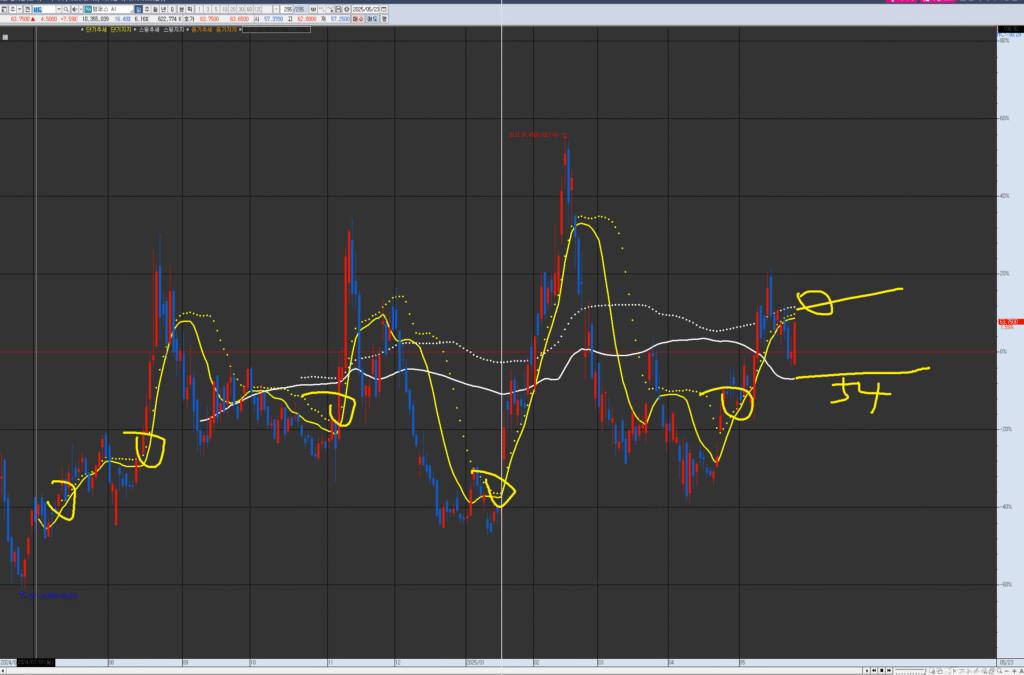
VPAR Chart Explanation This is Tempus AI (TEM.NAS), as requested for analysis. The circled areas in the past and present are potential short-term trend turning points; consolidation coupled with an upward trend represents a trading entry point. Each chart has its own wave pattern/trend. Currently, after breaking the short-term trend, there is a possibility of a price range/box between 54 and 67. Until it breaks through within approximately a month, consider checking key dates/events and trading within the box. If it shows a tendency to break below the 54 area, since the larger trend is an upward-sloping box, it is a position to respond within the box after checking for support around 45.
💡 Investment Opinion
Tempus AI (TEM) is rising on the back of booming AI-biotech momentum.
The recent breakout above $60 is not random—it reflects a shift in rhythm structure, aligned with revenue growth and market re-entry.
2-week expected return: +8.7% → $69.20 (Probability: 67%)
2-month expected return: +22.5% → $78.00 (Probability: 60%)
2-year return potential: +53.1% → $97.00 (Probability: 46%)
1. 📌 Summary
After peaking at $91 post-IPO and falling more than 35%, Tempus AI has now re-entered a breakout phase.
This new rhythm is supported by strong fundamentals and improving technical signals.
It is approaching a consolidation-to-expansion inflection point, making it a high-potential early-stage trade setup.
2. 📈 RHYTHMIX Rhythm Analysis
🔹 Monthly Rhythm
- Early IPO breakout → long pullback
- Now attempting to rebuild rhythm from base structure
- Monthly candles are recovering back toward the centerline
🔹 Weekly Rhythm
- Formed a $48–$66 box structure
- Recent re-entry into that range suggests second attempt breakout
- Dotted resistance ahead but volume shows potential for a push
🔹 Daily Rhythm
- Merging of short and mid-term moving averages
- Holding above the Bollinger centerline, stabilizing for a move
- Rebounded from Fibonacci retracement zone (0.5–0.618)
- MACD near positive crossover, RSI neutral — setup phase active
📌 Core Point ($59.20): Reclaimed key support inside the prior base
📌 Dotted Resistance ($65–67): Momentum trigger zone
📌 Trap-Reentry: Failed breakdown and reclaim rhythm pattern is in play
3. 📊 Financial Overview
- Market Cap: $10.8B
- Q1 Revenue: $255.7M (+75.4% YoY)
- FY Revenue Guidance: $1.25B (approx. +80% YoY)
- Net Loss: $68M (still negative, but stable)
- Adj. EBITDA: -$16.2M (improving)
4. ⚠️ News & Risks
- AI partnerships with AstraZeneca, Pathos
- Institutional support from Google, SoftBank, Franklin Templeton
- ⚠️ Risk from valuation (high P/S ratio) and ongoing net losses
- ⚠️ High volatility can create emotional traps near resistance zones
5. 🧠 Strategy Scenario (When, Why, How Much)
🎯 Entry Zone
$60.00 ~ $63.50 (Probability: 68%)
→ Just above the reclaimed centerline
→ Moving average confluence and Fibonacci pivot adds confidence
🥅 Targets
- 1st Target: $69.20 (Probability: 67%)
- 2nd Target: $78.00 (Probability: 60%)
- Long-Term Target: $97.00 (Probability: 46%) → based on Fibonacci Expansion (1.618 level)
🛡️ Stop-Loss / Risk Management
$56.80 (Probability: 72%)
→ Below this, the bullish rhythm breaks
→ Suggested for both position risk and emotional containment
6. 🌈 Outlook
Tempus AI shows potential rhythm recovery from consolidation.
It reflects a second-wave scenario that often catches early buyers by surprise.
As long as rhythm structure holds, this name could lead the AI-biotech resurgence.
“Tech stocks offer two chances—
The first wave is scary, the second wave feels too late.”
7. 🧩 Member-Only Deep Dive
📌 Institutional Flow
- Backed by Google, Franklin Templeton, SoftBank
- Recent holdings data shows increased accumulation
📌 Short Interest
- Approx. 7.3%
- Enough to fuel a potential short-covering rally after breakout
📌 Trend Sentiment
- Gaining inclusion in AI-focused healthcare ETFs
- Positive coverage across Forbes, Bloomberg, and AI trendwatch portals
