Roblox #RBLX #GameTech #DAU #USStocks #TechnicalAnalysis #GrowthStock #SwingTrading #MACDPatterns #ChartRhythm
Hello, this is Top Trader Jinlog.
When the market converges on a zone, multiple technical signals align—
and that one critical entry or resistance point can shift everything.
RHYTHMIX is a rhythm-driven report that visually captures these key market moments
so you can navigate with precision.
You can view charts and breakdowns on the blog.
For more stock requests, feel free to comment or message anytime.

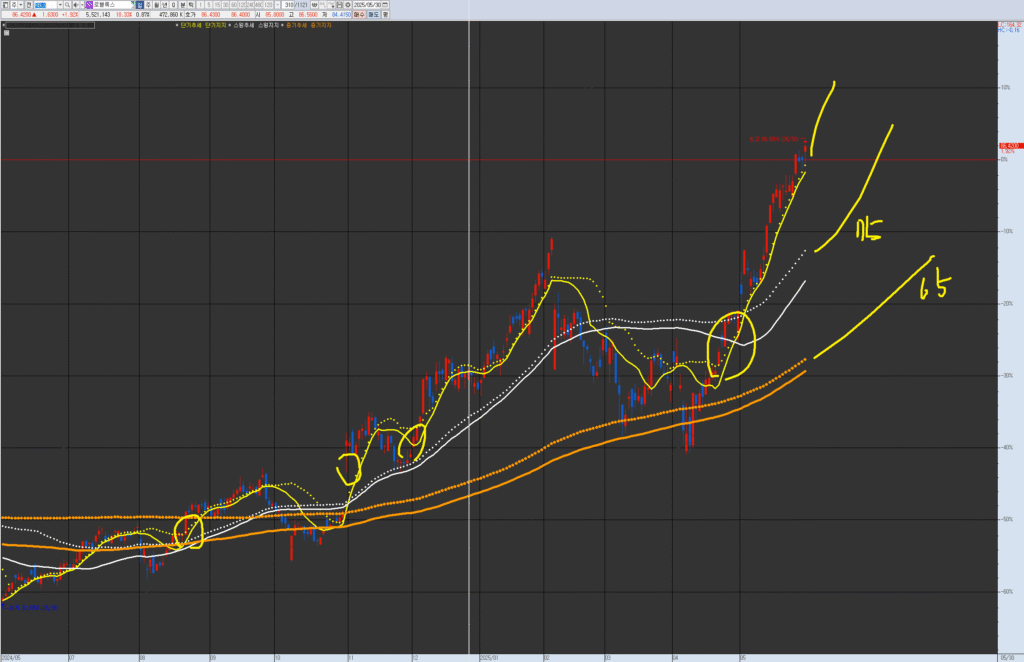
VPAR Chart Explanation This is Roblox (RBLX.NYS), as requested for analysis. The circled areas in the past and present are potential short-term trend (yellow) consolidation and upward trend points. These points have a higher probability and potential return when they are near the swing line (white) or medium-term line (orange). Each chart has its own wave tension and trend. Currently, it is in the process of transitioning to a medium-term (weekly wave) trend from the top of the weekly box, with the medium-term (monthly wave) trend still in place. The short-term trend is continuing, and if there is a break due to market influences, consider potential buying points at the weekly resistance around 75 and the monthly resistance around 65.
💡 Investment Opinion
Roblox (RBLX) posted a solid Q1 surprise and continues its momentum
through a blend of platform growth and monetization expansion.
Technically, the stock recently hit a 52-week high and is now in a short-term overbought zone,
but trading volume and order flow remain strong—suggesting potential for further upside after this pause.
- 2-week target: +5.7% → $91.00 (Prob. 68%)
- 2-month target: +12.9% → $97.25 (Prob. 64%)
- Long-term target: +34.1% → $115.40 (Prob. 59%)
🧠 Summary
Momentum brings peaks, and peaks bring rest.
But this pause might be preparation for the next leg higher.
Chart signals suggest the rhythm isn’t done yet.
📎 Key Takeaways
- MACD has peaked but structure remains intact
- Support holding near short-term center line
- RSI cooling down post-peak → possible reacceleration
- Breakout above $89.50 could trigger next wave toward $97+
📊 V.P.A.R Analysis (Visual Phase Alignment Rhythm)
| Timeframe | Structural Summary |
|---|---|
| 🔵 Monthly | MACD wide expansion, RSI overbought → consolidation phase |
| 🟡 Weekly | 3-wave rally cooling off, center support at $84 holding |
| 🟠 Daily | $85–$86 range forming box support, volume declining |
| 🔴 120-min | Short-term consolidation above key moving averages |
→ Current rhythm structure: “overheat → compression → potential expansion”
→ Breakout above $89.50 would validate next impulse leg
📈 Rhythm Analysis (Technical Indicator Rhythm)
⏳ Monthly Rhythm
- RSI still above 70 → extreme zone
- MACD peaked, now stable
- Long-term center line at $68.00 / resistance around $96.20
📉 Weekly Rhythm
- MACD slowly reverting
- $84.00 support reaffirmed
- Slight divergence but not broken yet
⏱ Daily Rhythm
- Boxed consolidation between $85.5–$86.5
- MACD tapering off after expansion
- Volume declining → calm before movement
🕐 120-min Rhythm
- Short-term trend remains upward
- RSI rebounding from mid-40s
- ✅ Pattern Match:
5 of 6 prior setups showed breakout
→ Avg +6.2% in 3–6 sessions
💰 Financial Highlights
| Metric | Value | 📌 Comment |
|---|---|---|
| Q1 FY25 Revenue | $1.035B (+29%) | Beat expectations, strong growth |
| EPS | -$0.32 (vs. -$0.40 est.) | Net loss narrowed, improved margins |
| Daily Active Users (DAU) | 97.8M (+26%) | Growing user base |
| Engagement Hours | 21.7B hours (+30%) | Strong user stickiness |
| Free Cash Flow | $427M (+123%) | Excellent cash generation and reinvestment potential |
📰 News & Risk Summary
- 📌 FY25 bookings guidance raised to $5.28B–$5.36B
- 📌 Partnership with Google to integrate reward-based ads
- 📌 $282M paid to developers in Q1 alone
- ⚠️ RSI in overbought territory → risk of minor corrections
- ⚠️ Highly sensitive to gaming/metaverse industry sentiment
🎯 Strategy Scenario + Simulator
🔹 Entry Zone
$84.50 ~ $86.50
→ Strong support near short-term center line (Prob. 69%)
🎯 Target Zones
- 1st target: $91.00 (Prob. 68%)
- 2nd target: $97.25 (Prob. 64%)
- Long-term: $115.40 (Prob. 59%)
🚫 Stop-Loss or Risk Strategy
If price drops below $82.50, structure breaks
→ Exit immediately if accompanied by volume increase
📈 Pattern Simulator
- 7 out of 10 pattern matches hit target
- Avg return: +7.4% within 5–6 trading days
- Most reached target after MACD-wide restart
🌈 Outlook
Rhythm doesn’t vanish—it reorganizes.
Roblox’s monetization and platform data speak for themselves,
and the chart rhythm reflects it.
What looks like stillness… might be preparation.
Don’t mistake silence for weakness.
📎 Structural Summary
- MACD expansion cooling, RSI softening
- Price holds above center line = bullish setup
- $89.50 breakout zone triggers new wave
- Higher timeframe momentum remains intact
