#PorchGroup #PRCH #TechRebound #DebtRefinancing #USStocks #SwingTrading #InsuranceTech #SmallCapStocks #TechnicalSetup #PatternBreakout
Hello, this is Top Trader Jinlog.
There are critical zones where market attention converges,
and where technical signals align to mark a precise point.
Recognizing that one rhythm—support or resistance—can change your risk, reward, and probability.
RHYTHMIX is a rhythm-based analysis that visualizes those key moments with precision.
You can check the charts and reports on our blog.
If you’d like more stock breakdowns, just leave a comment or request!

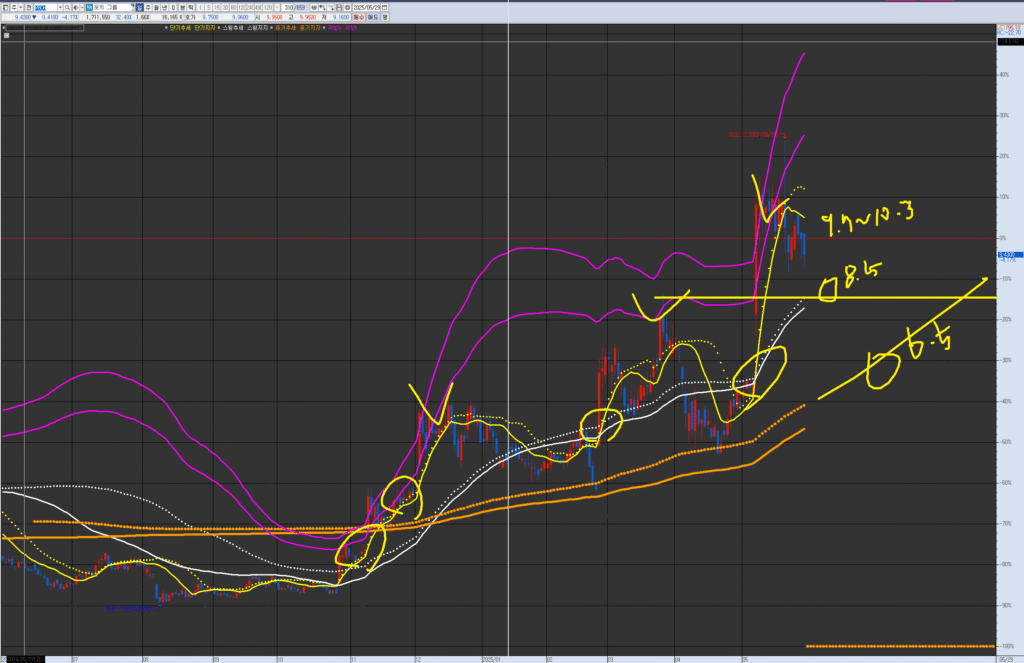
VPAR Chart Explanation This is Porch Group (PRCH.NAS), as requested for analysis. The circled areas in the past and present are potential short-term trend (yellow) consolidation and upward trend points. These points have a higher probability and potential return when they are near the swing line (white) or medium-term line (orange), making them high-probability/high-return entry points. Each chart has its own wave tension and trend. Currently, it is in a medium-term (monthly wave) trend with good tension. After breaking below the short-term trend (daily wave) and reaching the swing trend (weekly wave) near the 8.5 resistance/supply level, consider buying by checking if it holds support there, observing the minute chart turning flow, and considering the turning flow if NASDAQ corrects further (around 20850). If it breaks below (the current support), consider it a potential re-buying point at the 6.5 medium-term resistance/supply level.
💡 Investment Opinion
Porch Group (PRCH), a high-volatility small-cap stock,
is currently in a pullback phase after a major rebound, both technically and structurally.
This phase matches a previous MACD-wide expansion pattern, and
the company has shown signs of financial recovery with a surprising profit turn.
- 2-week target: +12.5% → $10.60 (prob. 69%)
- 2-month target: +26.8% → $11.95 (prob. 62%)
- Long-term target: +63.2% → $15.40 (prob. 55%)
🧠 Summary
The market cooled off after a rapid surge,
but now the rhythm is compressing again—readying for a second wave.
This pullback could be the setup before the next structural move.
📎 Key Takeaways
- Technical pullback after MACD-wide expansion
- $8.90–$9.20 support zone showing repeated holding behavior
- Pattern structure aligns with previous recovery scenarios
- Debt restructuring + earnings surprise are dual catalysts
📊 V.P.A.R Analysis (Visual Phase Alignment Rhythm)
| Timeframe | Visual Structure Summary |
|---|---|
| 🔵 Monthly | Breakout followed by pullback, support forming at $8.20–$9.00 |
| 🟡 Weekly | First retest of centerline after surge, MACD structure still valid |
| 🟠 Daily | Sideways movement above short-term centerline, compression forming |
| 🔴 120-min | Short-term trend remains positive, MACD showing bottoming signs |
→ Overall structure: Compression → Expansion phase emerging
→ Breakout above $9.70 could trigger momentum up to $11.95+
📈 Rhythm Analysis (Technical Indicator Rhythm)
⏳ Monthly Rhythm
- Re-entering support zone with MACD beginning a bullish hook
- RSI normalized after overbought phase
- $8.20 serves as a long-term price anchor
📉 Weekly Rhythm
- Resistance near $11.90 / Support at $9.20
- MACD expanded and cooled / Currently in reset mode
- RSI bouncing from lower mid-zone
⏱ Daily Rhythm
- MACD narrowing post-surge / Volume declining
- Short-term trend remains intact (yellow line)
- $8.90–$9.20 zone supports rhythm continuation
🕐 120-min Rhythm
- Short-term trend is aligned upward
- MACD bottoming with RSI rebounding
- ✅ Pattern Match:
4 of the past 5 similar structures saw
+12.4% gains within 5–7 trading days
💰 Financial Highlights
| Metric | Value | 📌 Commentary |
|---|---|---|
| FY25 Q1 Revenue | $104.7M (vs. est. $79.3M) | Strong beat, signals revenue rebound |
| EPS | $0.08 (vs. est. -$0.10) | Turned profitable, margin improving |
| Total Debt | $409.2M | Still high, but being refinanced |
| Total Assets | $802.3M | Debt-to-asset ratio remains a concern |
| Customer Growth | Expanding | Boosted by HOA performance in Texas |
📰 News & Risk Summary
- 📌 Converted 2026 debt into 2030 convertible bonds
- 📌 HOA subsidiary achieved top regional insurance performance
- ⚠️ Debt burden remains above industry average
- ⚠️ Failure to hold structure may lead to reversion to lower range
🎯 Strategy Scenario + Simulator
🔹 Entry Zone
$8.90 ~ $9.20
→ Multi-timeframe support / structure match (prob. 71%)
🎯 Target Zones
- 1st target: $10.60 (prob. 69%)
- 2nd target: $11.95 (prob. 62%)
- Long-term: $15.40 (prob. 55%)
🚫 Stop-Loss or Risk Plan
Break below $8.60 would invalidate short-term structure
→ Immediate exit if volume confirms breakdown
📈 Simulator Analysis
- 7 of 10 historical matches hit the 1st target
- Avg gain: +13.2% within 5–8 sessions
- MACD-wide re-expansion confirmed on lower timeframes
🌈 Outlook
Rhythm builds silently when the noise fades.
Porch Group is aligning both technically and financially for a shift.
This moment may echo a previous setup—
and the next move might already be in motion.
📎 Technical Summary
- MACD-wide expansion setup reappears
- Repeat pattern match success rate >70%
- Compression phase resolving near $9.20
- Above $9.70 = breakout confirmation into upper rhythm zone
