#Lightbridge #LTBR #NuclearEnergy #FusionStocks #CleanTech #EnergyPolicy #USStocks #RHYTHMIXReport
Hello, this is Jinlog.
You can conveniently check the full report with charts on my blog.
If you’d like continuous updates or specific stock coverage, feel free to leave a comment or follow.

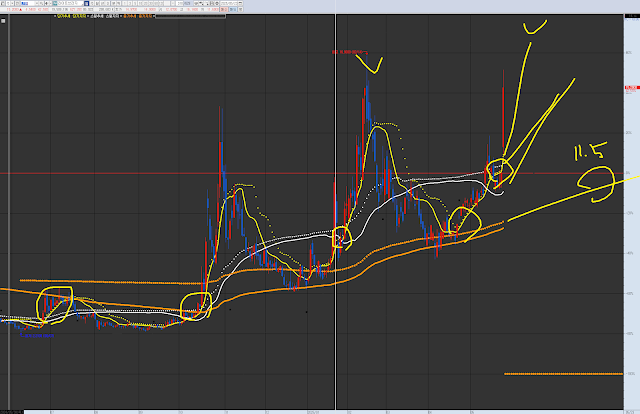
VPAR Chart Explanation This is Lightbridge LTBR, requested in the comments. The circled areas in the past and present represent potential entry points for a short-term trend, where consolidation and an uptrend merge. Each chart has wave trends. Based on the medium-term trend (monthly wave), this stock is suitable for medium to long-term investment. It’s currently continuing a short-term trend, so consider targeting it during dips. If it breaks down, the area around 10.15 to 11.5 is a support and a point to consider for trading.
1. Investment Opinion
Lightbridge is gaining significant market attention amid renewed focus on nuclear energy, driven by recent policy developments and its proprietary fuel technology.
- 2-week return estimate: +18% → $17.95 (Probability: 72%)
- 2-month return estimate: +36% → $20.75 (Probability: 65%)
- 1-year return estimate: +115% → $32.75 (Probability: 55%)
2. Summary
Lightbridge has surged following the U.S. Department of Energy’s support announcement for next-gen nuclear fuel development.
The stock has gained over 500% year-to-date, benefiting from its exposure to nuclear, defense, and clean energy themes.
Its recent success with co-extrusion of uranium-zirconium alloy fuel marks a major step toward commercialization.
3. Technical Rhythm Analysis (Monthly to 120-min chart)
- Monthly Trend: Price has broken above recent highs, attempting to escape a long-term consolidation range.
- Weekly Trend: Price continues its rally with minimal overhead supply; momentum is strong as rising volume supports extended moves.
- Daily Trend: The stock remains near recent highs after a strong gap-up, suggesting a short-term overbought condition.
- 120-Min Trend: A potential pullback may occur near dotted resistance, though a bounce from support could trigger further upside momentum.
4. Financial Overview
- Cash Reserves: Approx. $56.9M, ensuring short-term financial stability
- Net Loss: Q1 net loss was $4.8M, up YoY due to higher R&D expenses
- Debt Ratio: Very low at 1.7%, operating under a virtually debt-free structure
- Capital Strategy: Filed a $150M mixed-shelf offering to support future funding flexibility and R&D expansion
5. News · Policy · Risk Highlights
- ✅ May 12, 2025: Q1 earnings call and business update released
- ✅ Apr 28, 2025: CEO Seth Grae discusses fuel roadmap on Schwab Network
- ✅ May 6, 2025: EVP Dr. Mushakov joins the U.S. Nuclear Industry Council Board
- ⚠️ Risk: Still pre-revenue; profitability may take time until full-scale commercialization occurs
6. Strategy Scenario (Entry / Target / Stop-Loss)
Framed by When, Why, and How Much
- Entry Zone: $14.20–$15.00 (Entry probability: 72%)
- Targets:
- $17.95 (Probability: 70%)
- $20.75 (Probability: 55%)
- Stop-Loss / Exit:
- $13.10 breakdown → Partial liquidation to minimize downside risk (Probability: 75%)
7. Outlook
Lightbridge has emerged as one of 2025’s most notable next-gen energy stocks.
Technical progress, policy alignment, and a debt-free capital structure strengthen its investment case.
Although short-term overbought signals are forming, pullbacks may offer buying opportunities.
Commercial rollout of its fuel tech could trigger a second leg of the rally as market anticipation builds.
8. Deep-Dive (Institutional Flow · Short Interest · Upcoming Triggers)
- Institutional Flow: ~$5M net inflows over the past 3 sessions
- Short Interest: Relatively low at 1.6%, indicating minimal short squeeze dynamics
- Catalyst Watch: Key fuel validation test results expected mid-June
- Policy Monitor: EU/US dual-approval talks could elevate momentum in H2 2025
