#LFMD #Telehealth #HealthcareStocks #EarningsGrowth #ChartAnalysis #NASDAQ #MomentumStock
Intro
Hello, this is Jinlog.
You can check chart-based insights more conveniently on the blog.
For ongoing stock analysis, feel free to subscribe or comment.

Chart Explanation
This is LFMD, which you requested in the comments.
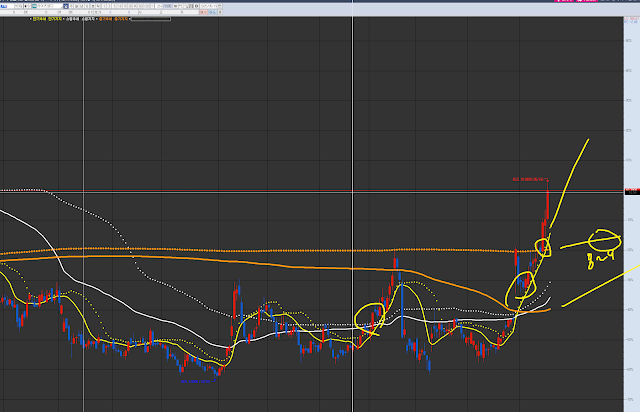
The circled areas in the past and present show potential short-term trend entry points. A confluence of merging trends and an upward trend indicate an entry point.
Each chart has its own wave pattern and trend.
LFMD has been in a swing wave since early May, and after breaking through mid-term resistance with a short-term trend, it is currently undergoing a short-term correction in the pre-market. If the short-term trend is broken, the entry point will be at the mid-term support level of 8-9 within approximately two weeks.
Investment Opinion
LFMD is riding a strong short-term rally backed by earnings recovery and business expansion.
However, entry at this level may involve risk due to technical overbought conditions and recent insider selling.
A cautious approach is advised unless a strong pullback occurs.
- 2-week expected return: +6.5% (probability 52%)
- 2-month expected return: +14.8% (probability 46%)
- 1-year expected return: +42.0% (probability 63%)
1. Summary
LifeMD, a telehealth company, recently expanded Medicare coverage and entered the women’s health segment through acquisition.
The company posted positive net income in Q1, with gross margins of 88%, reflecting operational efficiency.
While short-term price action is overheated, the medium-to-long-term momentum remains intact.
2. Technical Rhythm Analysis
🕰️ Monthly Chart:
- Broke out of long-term downtrend with 5 consecutive bullish candles
- Cleared mid-term resistance levels with upside alignment
- Price structure shows strong bottom support and trend transition
📉 Weekly Chart:
- Breaking above prior high near $10.5, attempting new base zone
- High volume confirms bullish momentum
- Near upper Bollinger Band — signals potential overheating
📉 Daily Chart:
- RSI, CCI both in overbought territory
- Needs to hold $9.20–$9.40 box for momentum continuation
- If sustained, $11.2–$11.7 range is next resistance target
⏱️ 120-Minute Chart:
- Post-surge consolidation phase
- Oscillators showing short-term weakness
- Breakdown below $10.2 may trigger rapid short-term decline
3. Financial Pulse
- Q1 Revenue: $65.7M (+23% YoY)
- Net Income: $1.38M (turned profitable)
- Gross Margin: 88%, above healthcare sector average
- EPS: $0.01 (missed est. $0.14) — slight sentiment correction
- Coverage expanding to 49 states by Q2 under Medicare
4. News & Risk Summary
- Major tailwinds from Medicare access and women’s health expansion
- Insider selling totaled ~$1.1M over last 3 months
- Technical indicators showing overheating
- Missed EPS may trigger minor sentiment cooling
5. Strategic Scenario
Summarized with When · Why · How Much.
- Entry Zone: $9.40–$9.80 (Entry Probability: 61%)
- Favorable if price retests short-term support range
- Targets:
- $11.00 (Reach Probability: 65%)
- $12.20 (Reach Probability: 48%)
- Stop-Loss: $8.80 (Breakdown Probability: 58%)
- Below box support may signal trend reversal
🔮 Outlook
LFMD is midstream in a momentum rally driven by renewed profitability and strategic expansion.
While the long-term outlook is promising, technical indicators suggest the stock may be overextended.
Watch for consolidation around support before entering, and monitor insider activity as a risk gauge.
🧩 Deep-Dive Report (Institutional Flow & News)
- Institutional inflow strong, volume 3x above average
- Short interest declining, but reversal risk remains
- Women’s health acquisition boosts long-term growth profile
- EPS miss offset by strong growth narrative
