#Imunon #IMNN #BiotechStocks #RhythmReport #TopTraderJinlog #NASDAQBiotech #CancerImmunotherapy #ClinicalTrials #HighVolatilityStocks #MicroCapStocks #RhythmAnalysis #BreakoutStocks #ETF #BiotechInvesting
Hello, this is TopTrader Jinlog.
You can check the details along with the chart on my blog.
If you want continuous analysis, please subscribe or leave a comment.
If you want to receive reports quickly, please choose the priority option.
.

Summary
✅ What breakout/ breakdown triggers should we watch for in this rhythm analysis? Let’s check below.
IMNN recently surged +95% in 3 trading days, driven by clinical trial and technology optimism, entering a high-volatility phase.
Chart analysis:
- 60-min: Upper box trap → consolidation attempt inside box
- Daily: Large bullish candle → testing upper box → potential correction
- Weekly: Strong bullish candle → exceeded upper box → pullback attempt
- Monthly: Breakout from low → overbought signals present
→ Classic post-breakout box consolidation phase, with mid-term bullish continuation potential depending on support.
1️⃣ Investment Opinion
📌 Short-term: Consolidating at upper box → watch for buy-the-dip opportunities
📌 Mid-term: Breakout continuation valid if trend restores
📌 Clinical news trigger could lead to another breakout
→ Performance Expectation
- 2-week target: +12.0% → $1.49 (Probability 60%)
- 2-month target: +39.0% → $1.85 (Probability 65%)
- 2-year long-term target: +185.7% → $3.80 (Probability 75%)
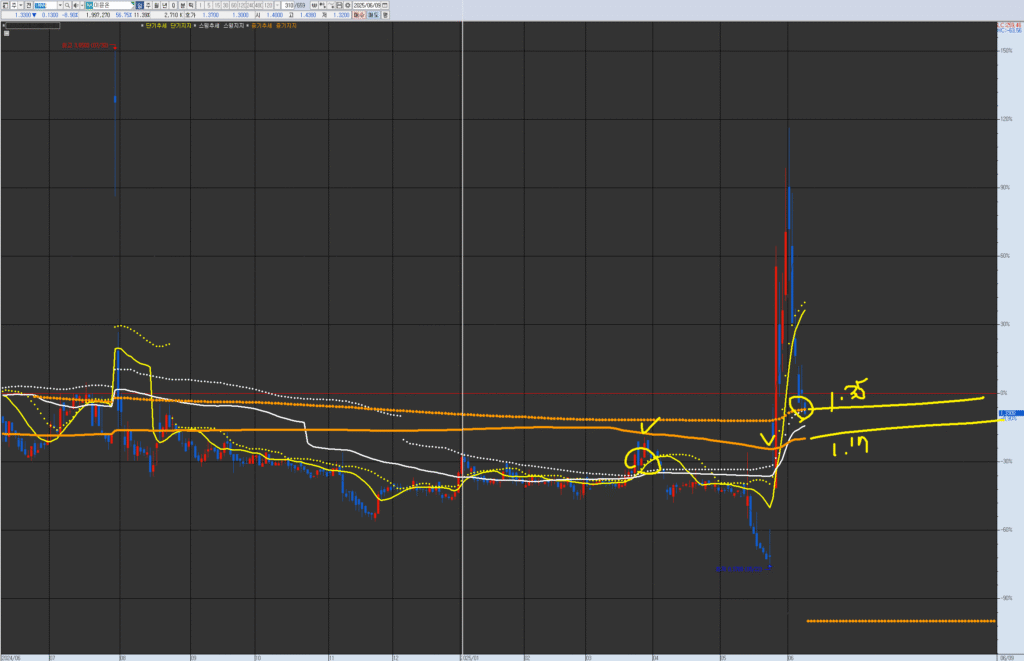
VPAR Chart Explanation This is ImmuneOn (IMNN), as requested for analysis. The circled areas in the past and present are potential short-term trend (yellow) consolidation and upward trend points. These points have a higher probability and potential return when they are near the swing line (white) or medium-term line (orange). Each chart has its own wave trend and tension. Currently, after breaking through the medium-term resistance/supply, it is in a state of reaching or being close to the swing and medium-term resistance/supply levels. However, there is a possibility that the tension may decrease, so consider re-entry after checking the support trend or event timing within approximately 2 weeks. For specific entry points, please refer to the strategy scenario and report.
3️⃣ VPAR Rhythm Analysis
Monthly
- Rhythm: Breakout from low → large bullish candle → overbought
- Bands: Exceeded upper dotted band → attempting pullback
- MACD: Bullish crossover → mid-term strength intact
Weekly
- Rhythm: Upper trap → consolidation in progress
- Bands: Testing box center after exceeding upper box
- RSI: Overbought → correcting
Daily
- Rhythm: Large bullish candle → upper trap → consolidation
- Bands: Testing Bollinger center band
- MACD: Divergence forming after sharp rise
60-min
- Rhythm: Upper trap → consolidating inside short-term box
- Volume: Declining after spike → awaiting next move
- Trap: Monitoring for breakout recovery
4️⃣ Financials
- Q1 2025 net loss: –$4.1M → continued losses
- Minimal revenue → clinical-stage company
- Cash: $11.2M → liquidity stable for next 12 months
- Dilution risk: Possible future capital raises
5️⃣ News & Risk Summary
News
- Immunotherapy platform (Celsion) → positive institutional reports
- Ongoing Phase 1/2 clinical trials → FDA-related optimism
- Potential external biotech fund investment interest
Risks
- Post-rally overbought zone
- Dilution risk (convertible notes/ warrants)
- Potential delays in clinical progress
6️⃣ Strategy Scenario
🎯 Entry
- Buy in the $1.25 ~ $1.30 range
🎯 Targets
- 1st target: $1.49 (Probability 60%)
- 2nd target: $1.85 (Probability 65%)
- 3rd target (Long-term): $3.80 (Probability 75%)
🚫 Stop-Loss
- Below $1.18 → trim half
- Below $1.05 → full exit
7️⃣ Outlook
Currently entering a post-breakout consolidation phase.
Mid-term bullish momentum remains valid, with clinical/ tech news likely to serve as triggers.
→ “Box center support will be critical for confirming a next breakout.”
8️⃣ Deep Report
- Institutional flow: Recent small net buying by institutions
- Short interest: ~4.8% → average for high-volatility biotech
- Social trends: Keywords like “clinical success,” “FDA approval hopes,” and “breakout biotech” trending
✅ Summary
IMNN is in a high-volatility rhythm consolidation phase,
with mid-term breakout potential still valid.
→ Watch box center support → buy-the-dip strategy recommended, but caution is advised as current phase is still overbought.
