NASDAQ100 #NDXanalysis #GeniusAct #CBDC #Stablecoin #JPMorgan #USBonds #TechSector #BoxPattern
Hello, this is Top Trader Jinlog.
You can conveniently review the full chart-based report on our blog.
For continued market updates, feel free to subscribe or leave a comment.

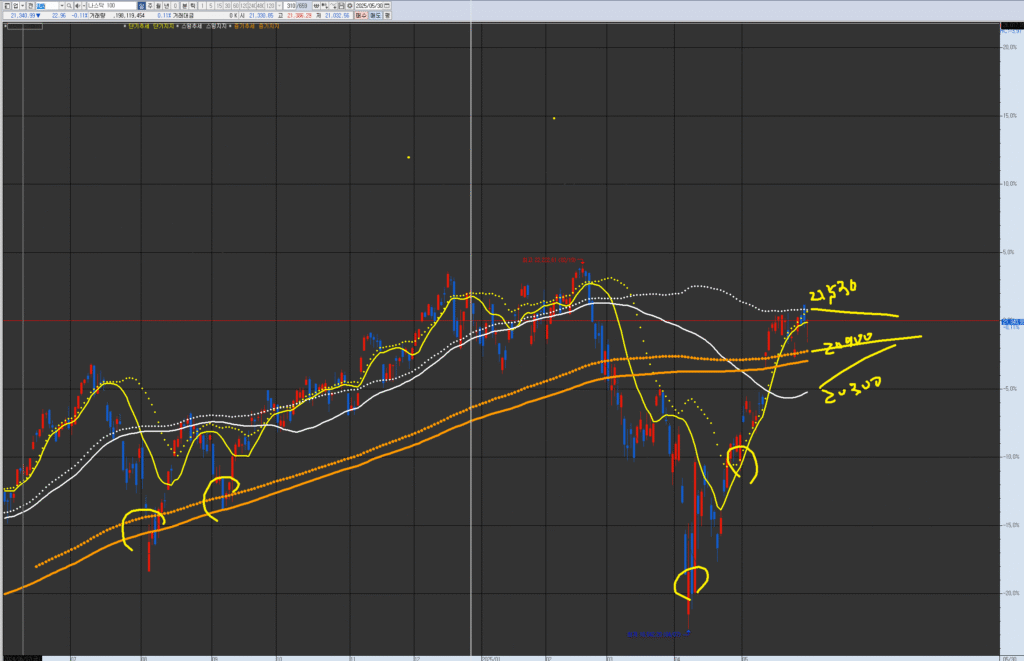
VPAR Chart Explanation This is the NASDAQ 100 chart. The circled areas in the past and present are potential short-term trend (yellow) consolidation and upward trend points. These points have a higher probability and potential return when they are near the swing line (white) or medium-term line (orange). Each chart has its own wave tension and trend. Currently, the key point of view is to check the re-ascending box pattern of the weekly wave (swing) between the short-term and medium-term resistance/supply levels.
Investment Outlook
NDX is currently positioned in a technical cooling phase with a time-based box consolidation, ahead of Q4’s anticipated policy event—the Genius Act.
According to rhythm structure, the likely scenario is: confirm support within the box → buy on dip → pre-policy breakout attempt.
→
- Short-term (2 weeks): Expected return range: -3% ~ +5% ($20,700 ~ $22,400), Probability: 60%
- Mid-term (2 months): Breakout to $22,800+ possible as policy expectations strengthen (Probability: 65%)
- Long-term (2 years): If digital payment systems expand and bond yield stabilizes, NDX may sustain a long-term uptrend (Probability: 70%)
→ Note: Monitor AI fatigue and political resistance risks
Summary
Market rallies rarely start suddenly.
The current range-bound and slow-moving behavior reflects energy being stored.
NDX is awaiting a pre-policy breakout, and as long as support holds, this could be a strategic buy-the-dip opportunity.
Key Variables
- The Genius Act, aimed at digital payment and surveillance infrastructure, is likely to go to vote in Q4 (October–December).
- The expansion of stablecoins (digitally pegged fiat assets) is increasing demand for U.S. Treasuries, pushing yields lower.
- Lower yields support tech equity performance, reinforcing NDX momentum.
- Within the tech sector, capital rotation toward AI and fintech remains visible.
Sector Snapshot (Key Rhythm Sectors Only)
- Technology (XLK / QQQ)
→ Testing box top resistance. Direction will likely be defined with policy anticipation momentum. - Semiconductors (SMH / SOXX)
→ AI flow remains but overbought cooling underway. Pullback expected until CPI in June. - Software (IGV)
→ High-valuation names continue under pressure. Support around mid-band remains critical. - Cloud & AI Infrastructure (CLOU / WCLD)
→ Long-term expectations intact, but short-term fatigue is visible. Hovering near lower supports. - Consumer Tech (XLY / AMZN)
→ Consumer weakness + high interest rates = continued underperformance. Lowest priority within tech subsectors.
Chart Alignment
- Monthly: Extended divergence with price nearing upper Bollinger band
- Weekly: Volume decline and trend weakening observed
- Daily: $21,500 resistance remains intact, while support at the rhythm midpoint is being tested
- 120-min: Box rhythm formation sustained near $21,080 midpoint
- 30-min: Downward wave patterns repeating
- 5-min: No clear direction—accumulation mode
Rhythm Trap
- Daily Midpoint: $21,200 remains key to holding pattern
- 120-min Rhythm Line (mid-band): $21,080
- Resistance at $21,500; support at $20,700
- Current price remains within a clear box range between rhythm midpoints and upper bands
- This setup is a textbook rhythm-based time correction pattern per RHYTHMIX Ver 7.0 standards
Scenario Paths
Bullish Scenario
- Entry Zone: $20,700–$21,100
- Conditions: Bond yields stay low, tech rotation resumes, policy anticipation rises
- Targets:
→ First: $21,800
→ Second: $22,400 (likely by August–September)
Bearish Scenario
- Breakdown Level: Below $20,600
- Conditions: Rising yields, MACD dead cross
- Targets:
→ First: $20,300
→ Second: $19,800
Strategic Plan
- Entry Zone: $20,700–$21,100 (Probability 66%)
- Targets:
→ $21,800 (Probability 65%)
→ $22,400 (Q4 policy pre-breakout, Probability 52%) - Stop-loss or Reversal: If price breaks below $20,600 (Probability 70%)
Outlook
With the Genius Act expected in 5–6 months, the market typically begins pricing in 3 months ahead.
Hence, the next 1 month may be box-bound with limited breakout potential.
Expect a clearer direction around August–September, as pre-policy optimism increases.
Until then, risk control and box support validation remain essential.
Deep-Dive Report
Bond Yield Trends
- 10-year U.S. Treasury yield has pulled back to 4.33%, creating a supportive environment for tech.
- Stablecoin-backed demand for bonds continues to weigh down yields.
- Yield volatility will remain the key to short-term tech rotations.
Institutional Flow
- ETFs in the tech sector continue to receive inflows.
- AI, semiconductors, and fintech show relative strength during dips.
Key News
- JP Morgan officially confirmed interest in issuing its own stablecoin.
- Genius Act may pass Senate by Q4.
- Political tension rising due to privacy surveillance concerns from opposition.
That concludes the NASDAQ100 (NDX) Market Report for May 31, 2025 – Ver 3.1.
If you found this helpful, don’t forget to subscribe or leave a comment.
The next critical trigger will likely be June CPI and shifts in interest rate tone.
