#CentrusEnergy #LEU #NuclearStocks #BreakoutWatch #RHYTHMIXReport
#UraniumTrend #MomentumStocks #EnergyShift #FibonacciBreakout
Hello, this is Top Trader Jinlog.
You can review the full chart and content visually on the blog.
If you’d like consistent insights, feel free to subscribe or leave a comment.
To receive priority reports faster, select the Priority Review option.

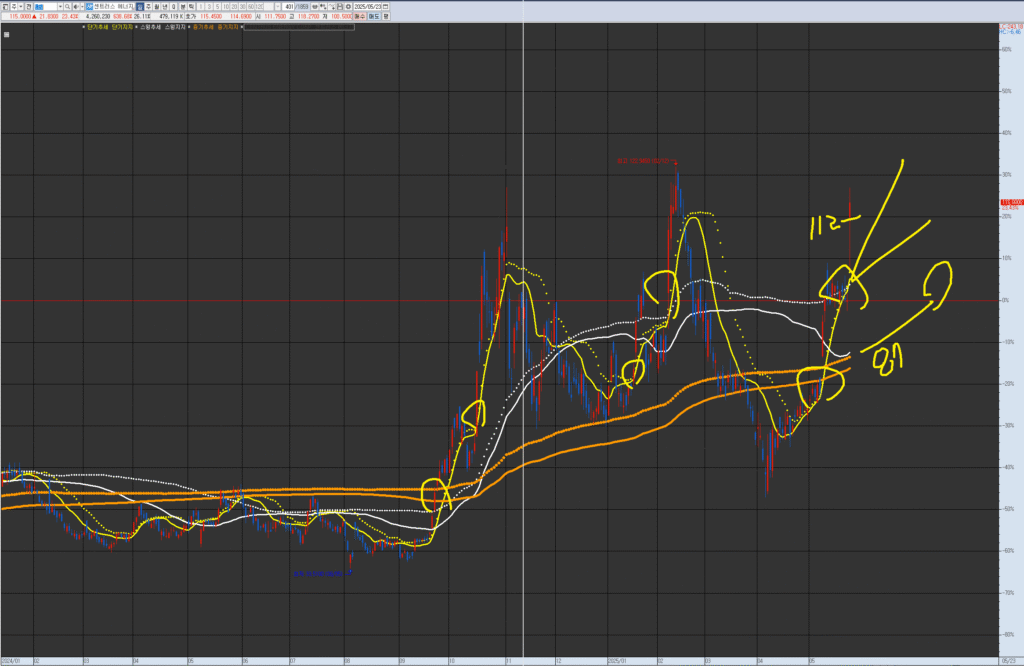
VPAR Chart Explanation This is Centrus Energy (LEU), as requested for analysis. The circled areas in the past and present are potential short-term trend turning points; consolidation coupled with an upward trend represents a trading entry point. Each chart has its own wave pattern/trend. Currently, it is in the process of re-ascending within both medium-term (monthly wave) and short-term (daily wave) trends. Consider trading for further upside if 112 holds as support following a dip (indicated by a lower wick) from the short-term deviation. If it breaks below the short-term line, consider it a potential trading point for a re-ascension after a period of swing accumulation/consolidation within a range above the medium-term resistance/support zone.
💡 Investment Opinion
Centrus Energy (LEU) surged past $100 in a powerful breakout move,
and this is not just a technical push—it marks a new rhythm expansion phase within a broader energy shift narrative.
2-week expected return: +10.4% → $127.00 (Probability: 72%)
2-month expected return: +26.5% → $145.00 (Probability: 63%)
2-year potential return: +64.1% → $188.00 (Probability: 51%)
1. 📌 Summary
LEU has seen over 100% growth recently, entering a 3rd stage of momentum acceleration.
It’s now undergoing a rhythmic pullback-consolidation phase near the $110 level.
If support holds at this “core point” zone, the next Fibonacci extension breakout to $145 becomes increasingly likely.
2. 📈 RHYTHMIX Rhythm Analysis
🔹 Monthly Rhythm
- Broke out of a long-term compression box.
- Volume expansion confirms entry into new valuation zone.
- Strong upside momentum with increasing Bollinger Band spacing.
🔹 Weekly Rhythm
- Follows the pattern: Compression → Vertical spike → Pullback → Retest
- Currently stabilizing around the $110 core point.
- MACD suggests a potential second wave setup after initial exhaustion.
🔹 Daily Rhythm
- Shows a classic pattern: short-term and mid-term moving averages merged and exploded.
- Now in a Fibonacci retracement zone (0.382–0.5) with rhythm rebuilding.
- Dotted-line resistance at $127 is the next breakout trigger, while core support remains around $107–$110.
📌 Core Point ($110): Key support pivot after breakout
📌 Dotted Resistance: $127 marks a rhythm breakout level
📌 Rhythm Trap: Watch for fake breakdown followed by strong intraday reversal (trap entry)
3. 📊 Financial Overview
- Market Cap: $1.93B
- EPS: $4.79
- P/E Ratio: 23.65x
- Cash Reserves: $470M
- Debt Ratio: Low — strong liquidity position maintained
4. ⚠️ News & Risk Summary
- Boosted by U.S. government nuclear policy initiatives
- Risk lies in sentiment-driven overextension; earnings growth must catch up
- Pullbacks can be sharp in momentum stocks—watch volume decline with caution
5. 🧠 Strategy Scenario (When, Why, How Much)
🎯 Entry Zone
$109.00 ~ $113.50 (Probability: 72%)
→ Rhythm support zone overlapping with Fibonacci retracement and Bollinger centerline
🥅 Target Zones
- 1st Target: $127.00 (Probability: 72%)
- 2nd Target: $145.00 (Probability: 63%)
- Long-Term Target: $188.00 (Fibonacci extension 1.618 level)
🛡️ Stop-Loss / Risk Control
$105.00 (Probability: 74%)
→ Drop below this key support invalidates the current rhythm wave
6. 🌈 Outlook
Centrus Energy now stands at a rhythmic inflection point.
If this second pullback resolves upward, the wave structure shifts from reversion to expansion continuation.
Nuclear and uranium themes remain hot, but timing the rhythm is key to surfing the wave.
“What coils tightly does so to spring forward.
The second breakout wave always travels further.”
7. 🧩 Member-Only Deep Report
📌 Institutional Flow
- Vanguard, JP Morgan show recent accumulation
- ETFs gradually increasing nuclear-related exposure
📌 Short Interest
- Current short interest: 6.2%
- Squeeze potential increases above $127 breakout
📌 Trend Sentiment
- Google Trends: “LEU” +380% over 1 month
- “Nuclear energy stocks” surging in finance forums & Reddit
