“I’m posting this because someone asked for a comparison. Please compare the charts.
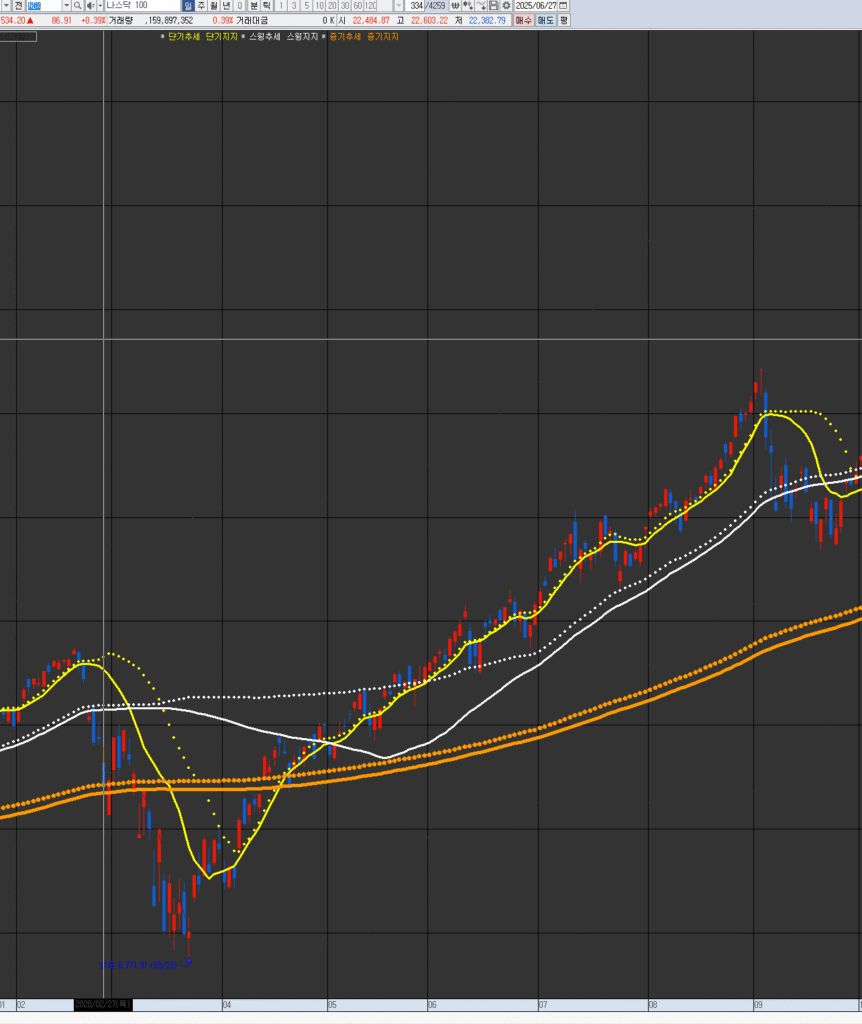
Currently, you can roughly see it around the June 2020 pattern position.
While it could go into a short-term trend, there’s a higher chance of a swing trend. So, if it gets pushed down by events/issues, react around the 21600 level for 2-3 months of swing trading.
Hello, this is JinLog, your top trader and market analyst. This video includes both technical analysis and scenario-based strategy discussions. Blog-format summary is also available for quick reference.
“Following the post regarding the one-month consolidation after the GENIUS Act announcement.”
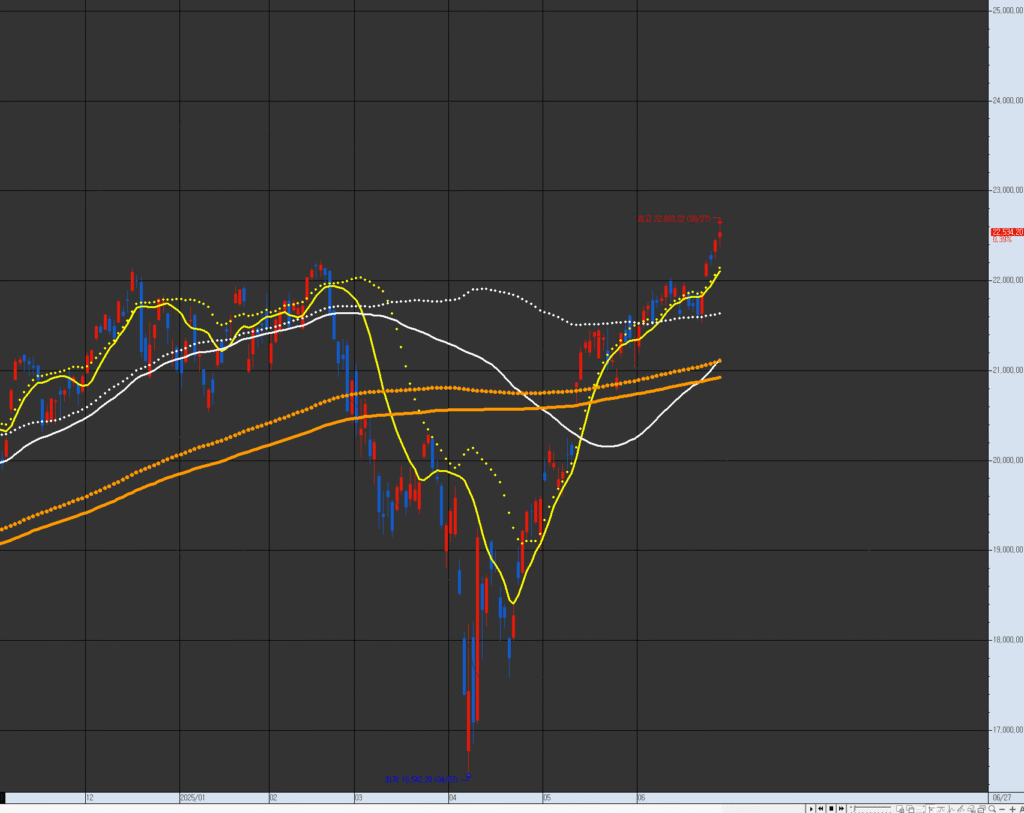
After the Genius Bill announcement, NDX entered a 1-month box range. With rhythm expansion now underway, key technical zones are being revisited. War-related headlines appear more like macro control narratives than actual market disruptors, suggesting a calculated transition into a full swing and mid-term expansion phase.
Short-term: Rhythm breakout likely → 23,000 in sight
Swing: Solid uptrend → Target 24,900
Mid-term: Long-range continuation to 26,270 expected
6. Chart Commentary
“This is the chart for the NASDAQ 100. Highlighted zones mark key merge points in short-term trends with bullish structure. The closer we are to swing or mid-term trendlines, the higher the probability and yield. Always monitor rhythm and wave formations on each chart.”
7. Rhythm Analysis
Short-term Rhythm: Expanding → Confirmed if 22,000 holds
Swing Rhythm: Entry at 21,650 shows upside potential in expanded structure
Mid-term Rhythm: Expansion phase activated → momentum buildup from 21,500
8. Financial Overview
(Index-based report – individual earnings not detailed)
Focused on composite earnings trend for tech/AI-heavy constituents
Current Phase: Wave 2 complete → Wave 3 onset likely
Scenario: Accumulation between 21,500 ~ 22,000
Wave Targets:
Wave 1 Peak: 23,000
Wave 2 Base: 21,500
Wave 3 Target: 26,270
12. Community Sentiment
Platform
Keywords
Sentiment
Summary
Reddit
#NDX, #AIstocks
Neutral → Bullish
“AI still hot, but overvaluation mentioned”
StockTwits
#NDX100, #GeniusBill
Rising Interest
“Expecting strong move after Genius Bill”
Twitter
#TechRally, #MacroControl
Mixed
“Even war seen as a market control tool”
13. Forecast & Risk Summary
Forecast: Box breakout likely, full swing wave beginning
Risks: Earnings disappointments, macro event fatigue, no fresh narratives
Flow Factors: Continued AI fund inflow from institutions
Technical Note: Rhythm expansion = signal for ongoing upward trend
14. Advanced Insights
Institutional flow: Confirmed via leveraged ETFs (e.g., TQQQ, QQQ)
Social mentions: +41% increase month-over-month
Short interest: Being covered in low-volume pops
AI flow: Heavily concentrated in mega-cap tech → mid-tier AI plateau
15. Disclaimer
This report is based on the VPAR Rhythm Analysis System. All rhythm flows, wave interpretations, and scenario setups are for educational and strategic reference. Investment decisions must be made at the investor’s sole discretion and risk.
Hello, this is Top Trader GeneLog. You can follow the chart-based insights directly on the blog, and live updates on index flow are shared through our real-time broadcast.
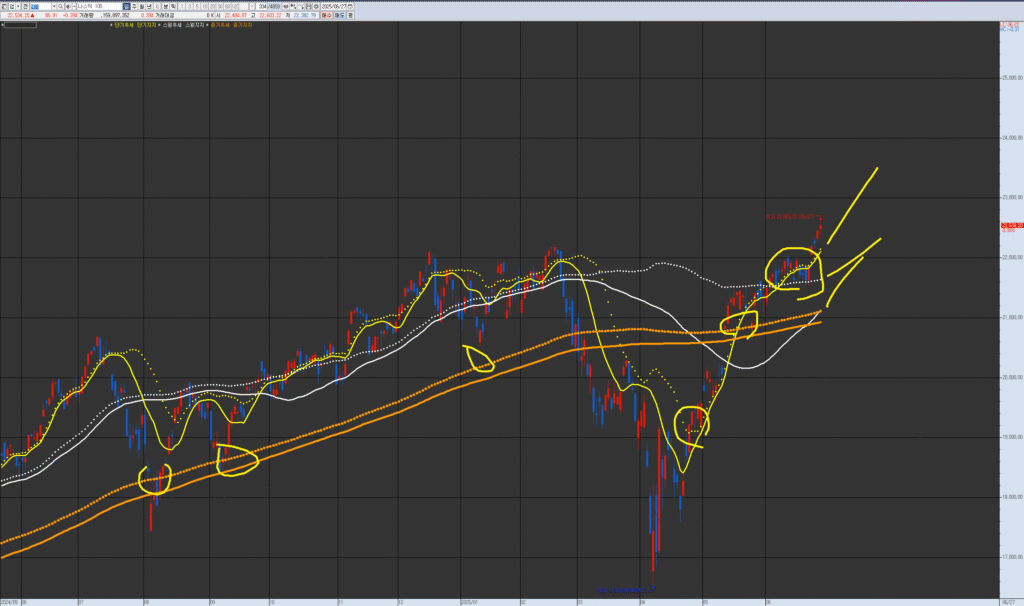
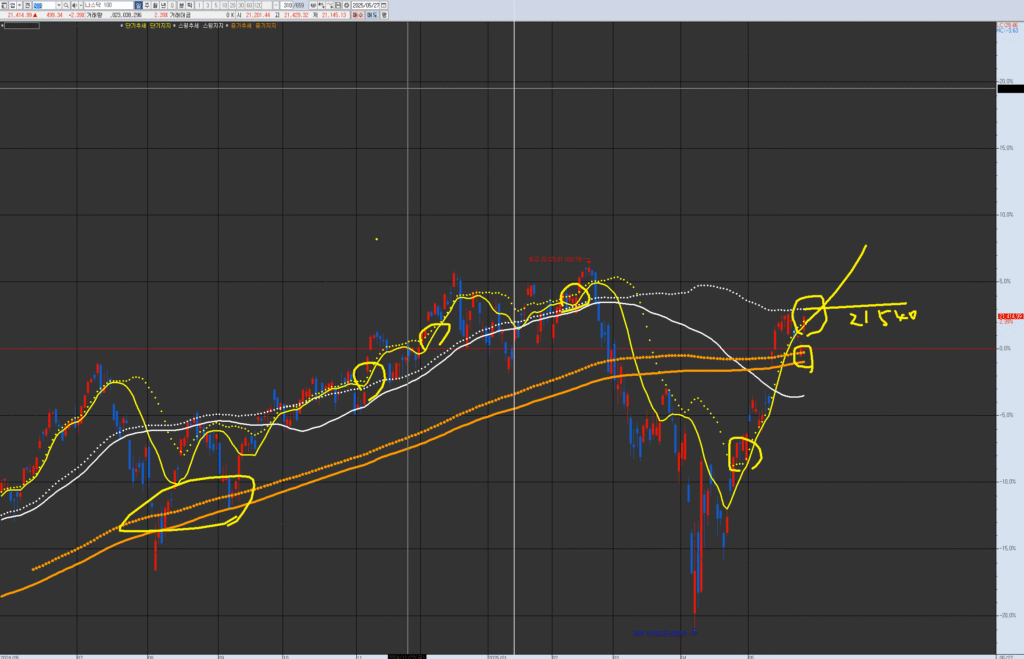
VPAR Chart Explanation This is the NASDAQ-100 chart. The circled areas in the past and present are potential short-term trend turning points; consolidation coupled with an upward trend represents a trading entry point. Each chart has its own wave pattern/trend. Following the rebound from the medium-term resistance/supply level mentioned last week, it is now showing a pattern of re-establishing itself on the short-term line. The trading point is focused on checking whether the swing support line at 21,540 is broken through within approximately one week.
The NASDAQ 100 closed the previous session with a strong upward reversal (+2.28%). As of the pre-market, it’s hovering at 21,476 and re-approaching the swing support dotted line at 21,540.
Asian markets closed mixed; Europe slightly weakened with consumer sectors lagging. U.S. futures are tilting bullish, led by tech—suggesting a possible micro-phase reversal in rhythm.
2. ⏱ Alignment View – U.S. Indices in Sync
S&P 500 Futures: +0.2%
NASDAQ 100 Futures: +0.5%
Dow Futures: +0.1%
The rhythm across major indices is synchronized bullish, and NASDAQ 100 is pacing the charge as it tests above key swing trendline zones.
3. 🌀 Rhythm Trap – Sector Rotation Highlights
AI / Semiconductors: Eyeing a new breakout near resistance
Fintech / Consumer: Potential rebound entry from recent dips
Energy / Commodities: Pullback in oil = resistance test ongoing