Hello, this is TopTrader JinLog. Here’s a quick market update beyond Bitcoin:
On the left-hand Bitcoin chart, you’ll see a sharp spike pattern off swing-trend support—please refer to my previous post for details. Ethereum is also at a swing consolidation/formation area, which marks the start of a short-term trend and signals a potential shift into a swing-trend phase depending on order-flow.
Hello, this is JinLog, your top trader and market analyst. This video includes both technical report analysis and in-depth scenario discussion. You can also find a blog-style summary of this report for quick reference.
4. Summary
After trading inside a box range for the past month without major deviation, Bitcoin has cleared both short-term and swing traps and shows signs of a renewed swing wave.
Short-term trend maintained with rhythm expansion → Entry at $107,700
Swing trend maintained with stable rhythm → Entry at $106,000
Mid-term trend maintained with rhythm expansion → Entry at $97,150
Current price: $109,360
5. Investment Outlook
Short-term: Monitor for consolidation above $107,700; potential rally toward $118,000
Swing: Rhythm stability around $106,000 suggests robust support; target $118,000
Mid-term: Expansion from $97,150 supports a run to $136,000
6. Chart Commentary
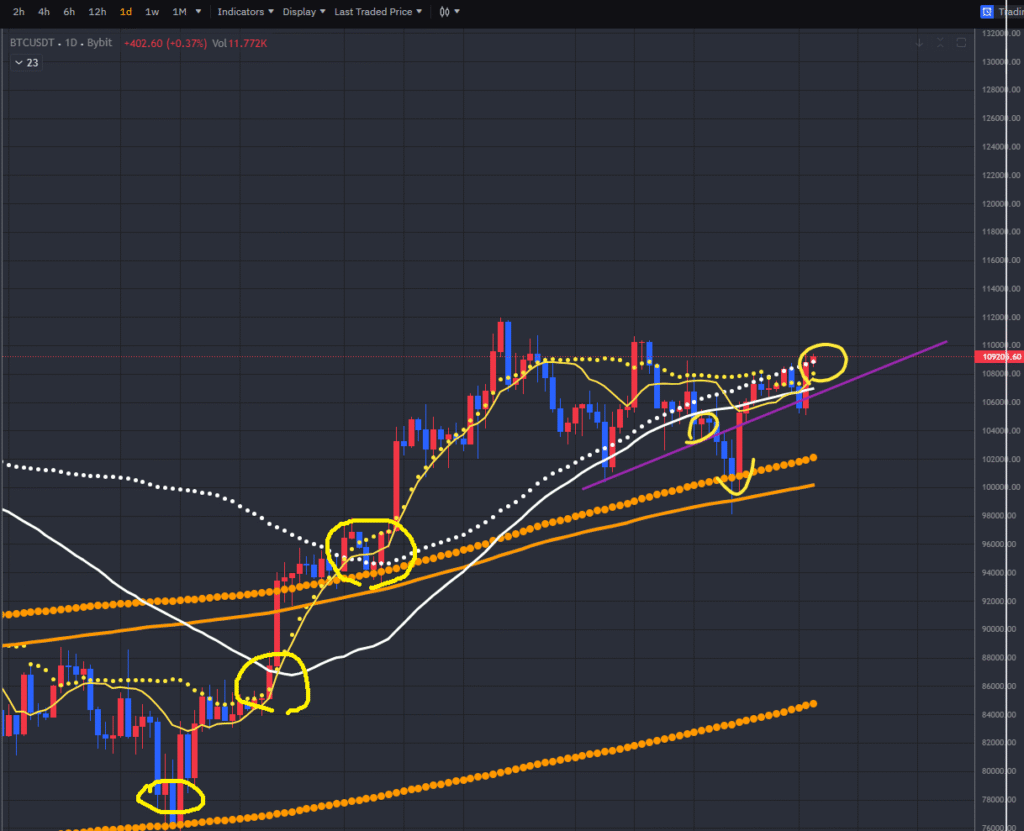
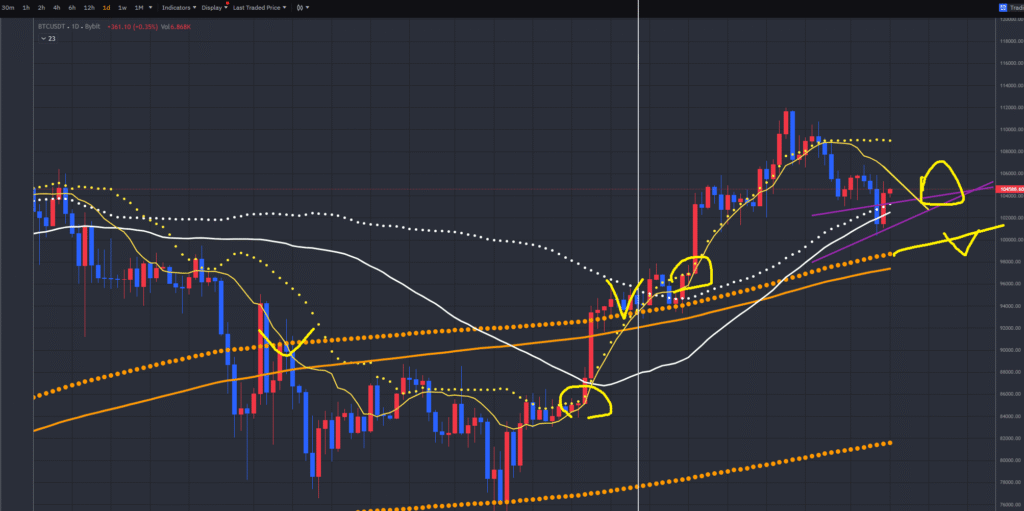
“This is the Bitcoin chart you requested. Circled regions highlight trap-release points where technical criteria converged. Entries near those swing-trap clearances historically offer higher probability setups. Always check rhythm flows and wave structures on each timeframe.”
7. Rhythm Analysis
Short-term Rhythm: Expansion phase confirmed after trap release; momentum building
Swing Rhythm: Stabilized contraction with clear support at $106,000; ready for expansion
Technical Note: Key levels at $107.7k, $106k, and $97.15k
14. Advanced Insights
Institutional Flow: High-net-worth allocations increasing via OTC desks
Social Metrics: Bullish engagement up 45% month-over-month on crypto forums
On-Chain Indicators: Active addresses and hashrate trending higher
AI-Driven Signals: Algorithmic sentiment turning positive since trap release
15. Disclaimer
This report is based on the VPAR Rhythm Analysis System. All rhythm flows, wave counts, and scenario setups are for informational purposes only. Investment decisions should be made at the investor’s own discretion and risk.
Hello, this is TopTrader Jinlog. You can check this report with full charts on my blog. If you need continuous analysis, feel free to subscribe or comment. For faster access to reports, please choose the priority processing option.
VPAR Chart Explanation This is the Bitcoin chart, as requested for analysis. The circled areas in the past and present are potential short-term trend (yellow) consolidation and upward trend points. These points have a higher probability and potential return when they are near the swing line (white) or medium-term line (orange). Each chart has its own wave tension and trend. Currently, it is above the medium-term (monthly wave) and swing (weekly wave) resistance/supply levels. It has been in a short-term downtrend for approximately 2 weeks. We are looking at the breakthrough and support trend of this short-term line to consider a swing entry point.
1️⃣ Investment Opinion
📌 Short-term wait & buy on dips → focus on rhythm convergence phase 📌 Medium-term upward trend potential remains valid 📌 Potential for repeated surge/dip cycles driven by policy/political news and ETF flows
Bitcoin entered a corrective phase after reaching its all-time high. Monthly and weekly charts show ongoing rhythm convergence, while daily and 120-min charts are attempting a short-term rebound after establishing a local bottom. Despite increased volatility from ETF outflows and political issues, technically Bitcoin is regaining box center and positioning for potential re-acceleration.
3️⃣ VPAR Rhythm Analysis
🌕 Monthly
Strong acceleration followed by first clear convergence phase.
No Trap detected — maintaining position near box center.
Rhythm indicates potential for re-acceleration in this phase.
🟢 Weekly
BW (Band Width) convergence clearly underway; overbought pressure is easing.
Key resistance at ~$111,800; box center support $100,000105,000.
Weekly RSI / MACD trending back to neutral — watch for momentum recovery.
Weak US jobs data → rising Fed rate cut expectations → mid-term bullish catalyst for BTC (contents.premium.naver.com)
⚠️ Key Risks
Prolonged ETF outflows could drive BTC below $100K.
Political comments (Trump, etc.) could continue to increase volatility.
Deeper correction possible toward $97K99K if rhythm fails to regain upside momentum.
6️⃣ Strategic Scenario
🎯 Entry
Accumulate $102,000104,000 zone.
Add more if ~$100K fails — target $97K99K zone.
🎯 Targets
1st target: $109,580 (probability 66%)
2nd target: $116,320 (probability 61%)
Long-term target: $180,300 (probability 55%)
🚫 Stop-Loss
Close below $96,500 triggers stop-loss.
7️⃣ Outlook
“The market feeds on uncertainty — the key is to catch the moment when rhythm starts to pulse again.” Bitcoin is now in its first significant correction since reaching its all-time high. Technically, it still holds strong potential for re-acceleration after completing this convergence phase. While short-term risks stem from ETF outflows and political comments, medium-term bullish cycle remains intact.
8️⃣ Deep Dive
Institutional flows: ETF outflows observed — monitoring for signs of reinflows.
Short interest (funding rates): shifting from neutral to slightly long-biased.
Social trends: BTC-related mentions surged recently but now stabilizing — further interest likely if $100K holds.