Hello, this is TopTrader JinLog. Here’s a quick market update beyond Bitcoin:
On the left-hand Bitcoin chart, you’ll see a sharp spike pattern off swing-trend support—please refer to my previous post for details. Ethereum is also at a swing consolidation/formation area, which marks the start of a short-term trend and signals a potential shift into a swing-trend phase depending on order-flow.
Hello, this is JinLog, your top trader and market analyst. This video includes both technical report analysis and in-depth scenario discussion. You can also find a blog-style summary of this report for quick reference.
4. Summary
After trading inside a box range for the past month without major deviation, Bitcoin has cleared both short-term and swing traps and shows signs of a renewed swing wave.
Short-term trend maintained with rhythm expansion → Entry at $107,700
Swing trend maintained with stable rhythm → Entry at $106,000
Mid-term trend maintained with rhythm expansion → Entry at $97,150
Current price: $109,360
5. Investment Outlook
Short-term: Monitor for consolidation above $107,700; potential rally toward $118,000
Swing: Rhythm stability around $106,000 suggests robust support; target $118,000
Mid-term: Expansion from $97,150 supports a run to $136,000
6. Chart Commentary
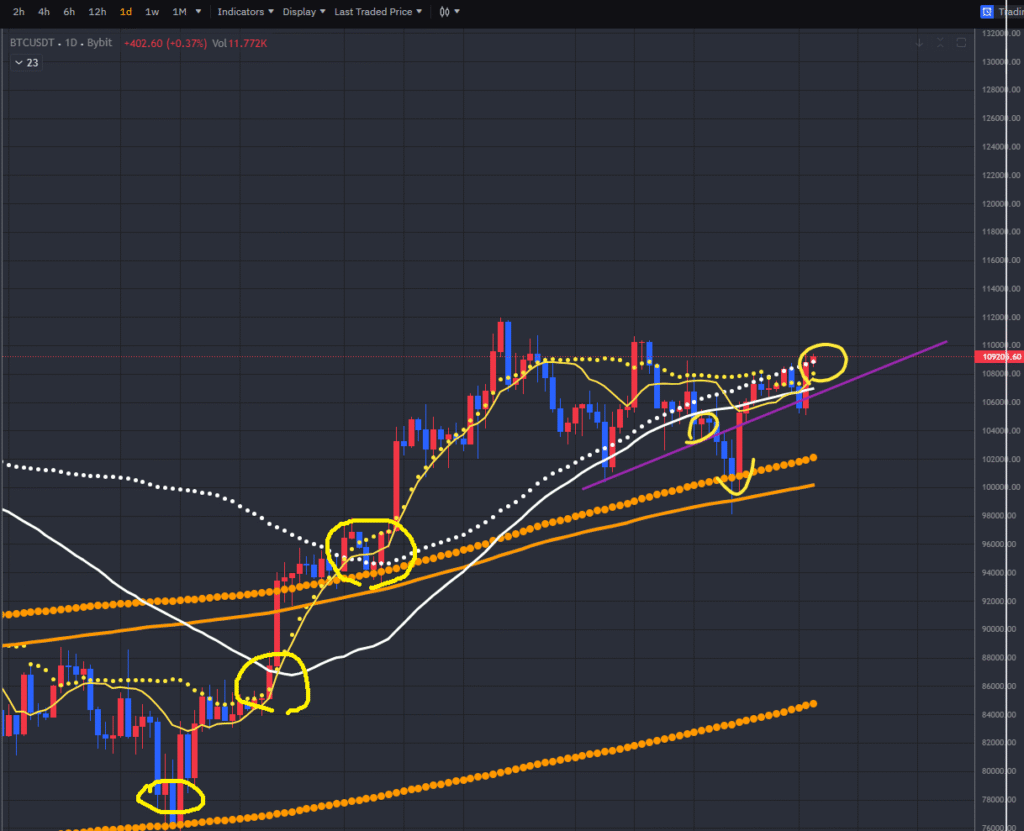
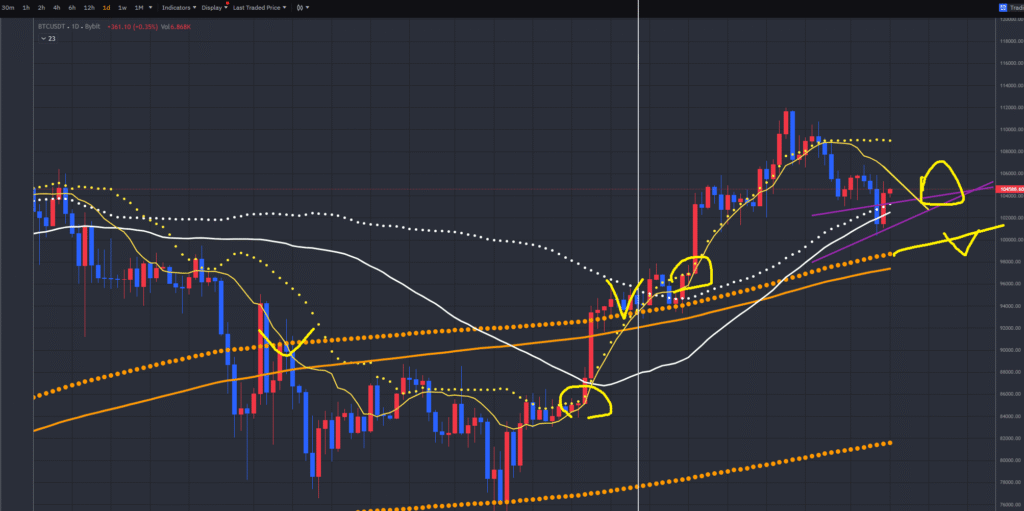
“This is the Bitcoin chart you requested. Circled regions highlight trap-release points where technical criteria converged. Entries near those swing-trap clearances historically offer higher probability setups. Always check rhythm flows and wave structures on each timeframe.”
7. Rhythm Analysis
Short-term Rhythm: Expansion phase confirmed after trap release; momentum building
Swing Rhythm: Stabilized contraction with clear support at $106,000; ready for expansion
Technical Note: Key levels at $107.7k, $106k, and $97.15k
14. Advanced Insights
Institutional Flow: High-net-worth allocations increasing via OTC desks
Social Metrics: Bullish engagement up 45% month-over-month on crypto forums
On-Chain Indicators: Active addresses and hashrate trending higher
AI-Driven Signals: Algorithmic sentiment turning positive since trap release
15. Disclaimer
This report is based on the VPAR Rhythm Analysis System. All rhythm flows, wave counts, and scenario setups are for informational purposes only. Investment decisions should be made at the investor’s own discretion and risk.
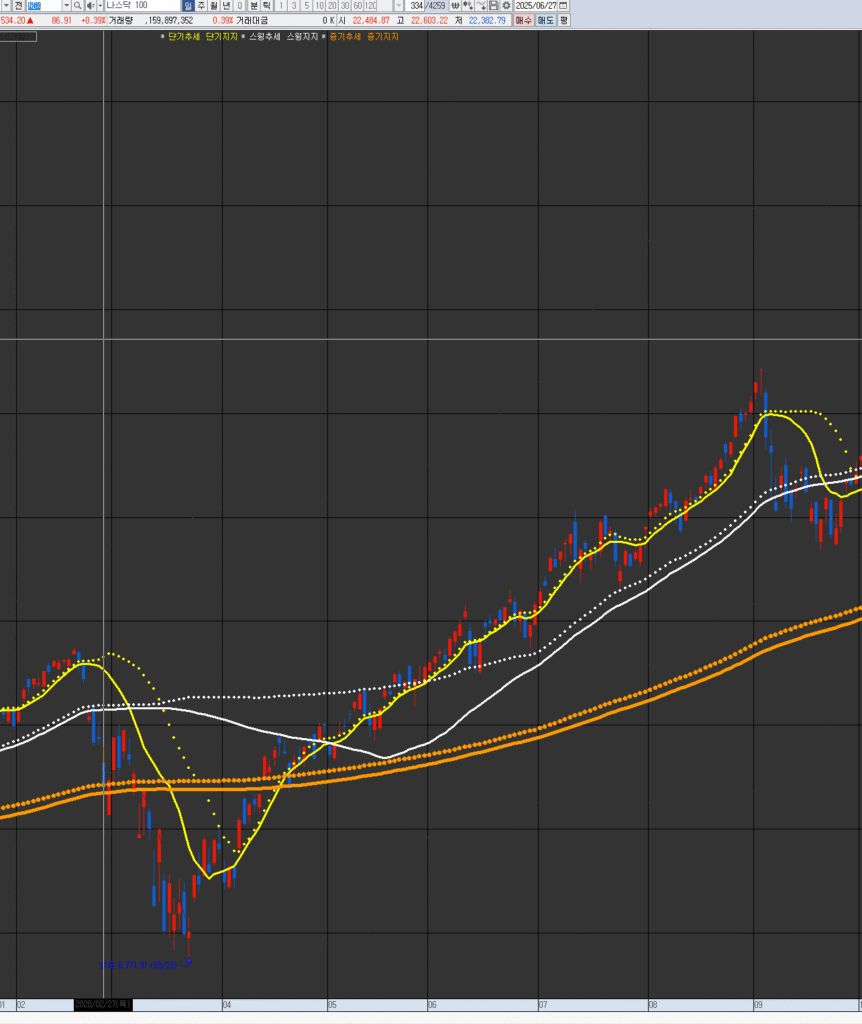
“I’m posting this because someone asked for a comparison. Please compare the charts.
Currently, you can roughly see it around the June 2020 pattern position.
While it could go into a short-term trend, there’s a higher chance of a swing trend. So, if it gets pushed down by events/issues, react around the 21600 level for 2-3 months of swing trading.
Hello, this is JinLog, your top trader and market analyst. This video includes both technical analysis and scenario-based strategy discussions. Blog-format summary is also available for quick reference.
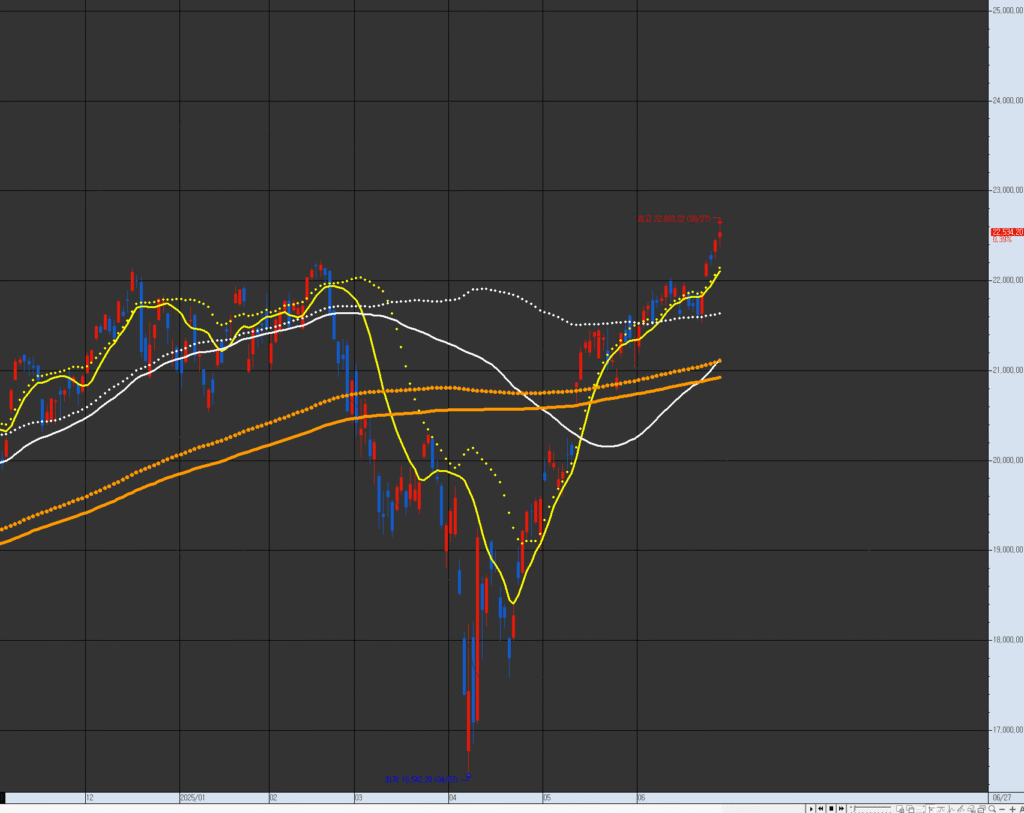
“Following the post regarding the one-month consolidation after the GENIUS Act announcement.”
After the Genius Bill announcement, NDX entered a 1-month box range. With rhythm expansion now underway, key technical zones are being revisited. War-related headlines appear more like macro control narratives than actual market disruptors, suggesting a calculated transition into a full swing and mid-term expansion phase.
Short-term: Rhythm breakout likely → 23,000 in sight
Swing: Solid uptrend → Target 24,900
Mid-term: Long-range continuation to 26,270 expected
6. Chart Commentary
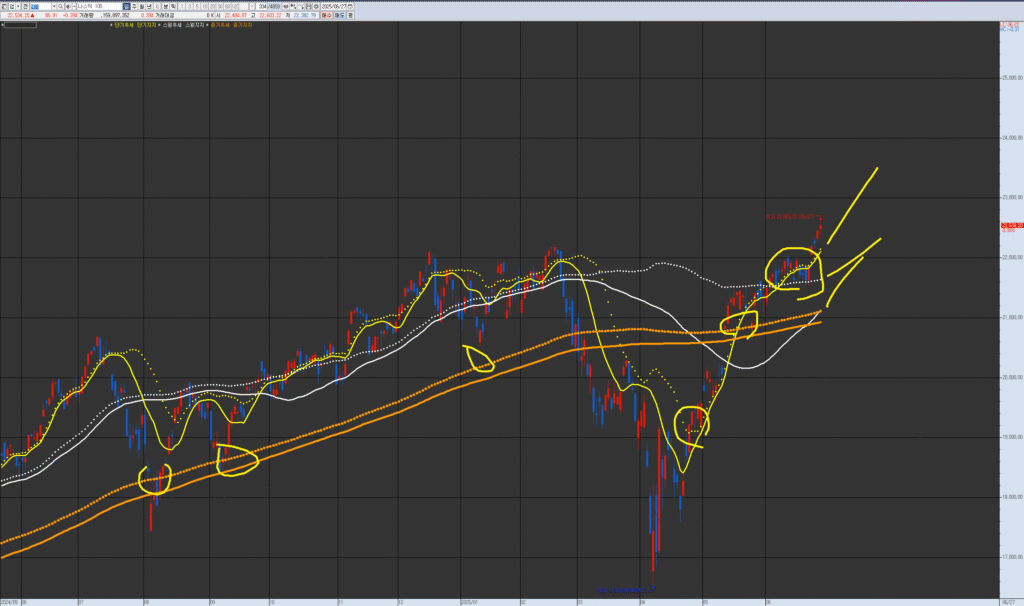
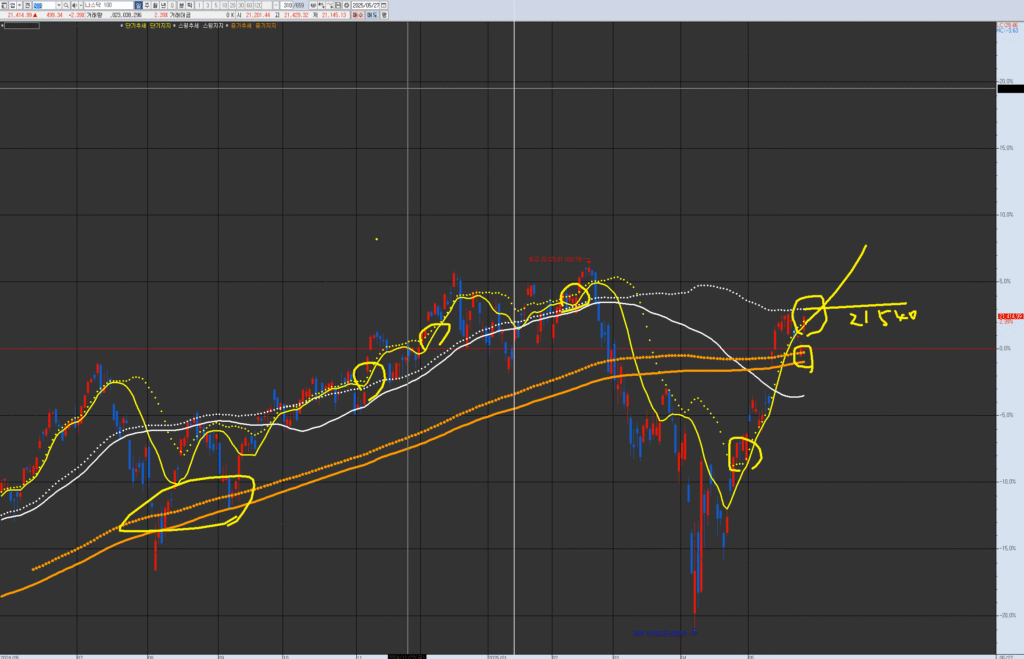
“This is the chart for the NASDAQ 100. Highlighted zones mark key merge points in short-term trends with bullish structure. The closer we are to swing or mid-term trendlines, the higher the probability and yield. Always monitor rhythm and wave formations on each chart.”
7. Rhythm Analysis
Short-term Rhythm: Expanding → Confirmed if 22,000 holds
Swing Rhythm: Entry at 21,650 shows upside potential in expanded structure
Mid-term Rhythm: Expansion phase activated → momentum buildup from 21,500
8. Financial Overview
(Index-based report – individual earnings not detailed)
Focused on composite earnings trend for tech/AI-heavy constituents
Current Phase: Wave 2 complete → Wave 3 onset likely
Scenario: Accumulation between 21,500 ~ 22,000
Wave Targets:
Wave 1 Peak: 23,000
Wave 2 Base: 21,500
Wave 3 Target: 26,270
12. Community Sentiment
Platform
Keywords
Sentiment
Summary
Reddit
#NDX, #AIstocks
Neutral → Bullish
“AI still hot, but overvaluation mentioned”
StockTwits
#NDX100, #GeniusBill
Rising Interest
“Expecting strong move after Genius Bill”
Twitter
#TechRally, #MacroControl
Mixed
“Even war seen as a market control tool”
13. Forecast & Risk Summary
Forecast: Box breakout likely, full swing wave beginning
Risks: Earnings disappointments, macro event fatigue, no fresh narratives
Flow Factors: Continued AI fund inflow from institutions
Technical Note: Rhythm expansion = signal for ongoing upward trend
14. Advanced Insights
Institutional flow: Confirmed via leveraged ETFs (e.g., TQQQ, QQQ)
Social mentions: +41% increase month-over-month
Short interest: Being covered in low-volume pops
AI flow: Heavily concentrated in mega-cap tech → mid-tier AI plateau
15. Disclaimer
This report is based on the VPAR Rhythm Analysis System. All rhythm flows, wave interpretations, and scenario setups are for educational and strategic reference. Investment decisions must be made at the investor’s sole discretion and risk.
Hello, this is TopTrader Jinlog. You can check this report with full charts on my blog. If you need continuous analysis, feel free to subscribe or comment. For faster access to reports, please choose the priority processing option.
VPAR Chart Explanation This is the Bitcoin chart, as requested for analysis. The circled areas in the past and present are potential short-term trend (yellow) consolidation and upward trend points. These points have a higher probability and potential return when they are near the swing line (white) or medium-term line (orange). Each chart has its own wave tension and trend. Currently, it is above the medium-term (monthly wave) and swing (weekly wave) resistance/supply levels. It has been in a short-term downtrend for approximately 2 weeks. We are looking at the breakthrough and support trend of this short-term line to consider a swing entry point.
1️⃣ Investment Opinion
📌 Short-term wait & buy on dips → focus on rhythm convergence phase 📌 Medium-term upward trend potential remains valid 📌 Potential for repeated surge/dip cycles driven by policy/political news and ETF flows
Bitcoin entered a corrective phase after reaching its all-time high. Monthly and weekly charts show ongoing rhythm convergence, while daily and 120-min charts are attempting a short-term rebound after establishing a local bottom. Despite increased volatility from ETF outflows and political issues, technically Bitcoin is regaining box center and positioning for potential re-acceleration.
3️⃣ VPAR Rhythm Analysis
🌕 Monthly
Strong acceleration followed by first clear convergence phase.
No Trap detected — maintaining position near box center.
Rhythm indicates potential for re-acceleration in this phase.
🟢 Weekly
BW (Band Width) convergence clearly underway; overbought pressure is easing.
Key resistance at ~$111,800; box center support $100,000105,000.
Weekly RSI / MACD trending back to neutral — watch for momentum recovery.
Weak US jobs data → rising Fed rate cut expectations → mid-term bullish catalyst for BTC (contents.premium.naver.com)
⚠️ Key Risks
Prolonged ETF outflows could drive BTC below $100K.
Political comments (Trump, etc.) could continue to increase volatility.
Deeper correction possible toward $97K99K if rhythm fails to regain upside momentum.
6️⃣ Strategic Scenario
🎯 Entry
Accumulate $102,000104,000 zone.
Add more if ~$100K fails — target $97K99K zone.
🎯 Targets
1st target: $109,580 (probability 66%)
2nd target: $116,320 (probability 61%)
Long-term target: $180,300 (probability 55%)
🚫 Stop-Loss
Close below $96,500 triggers stop-loss.
7️⃣ Outlook
“The market feeds on uncertainty — the key is to catch the moment when rhythm starts to pulse again.” Bitcoin is now in its first significant correction since reaching its all-time high. Technically, it still holds strong potential for re-acceleration after completing this convergence phase. While short-term risks stem from ETF outflows and political comments, medium-term bullish cycle remains intact.
8️⃣ Deep Dive
Institutional flows: ETF outflows observed — monitoring for signs of reinflows.
Short interest (funding rates): shifting from neutral to slightly long-biased.
Social trends: BTC-related mentions surged recently but now stabilizing — further interest likely if $100K holds.
Water utility stocks in the U.S. are quietly gaining traction. Did you know that global asset management giant BlackRock has been steadily investing in several major water-related companies?
In this post, we explore the top U.S. water companies that have caught BlackRock’s eye and break down why this sector might hold your next hidden gem.
💦 Top 5 U.S. Water Companies in BlackRock’s Portfolio
American Water Works (AWK)
The largest water utility company in the U.S.
BlackRock’s ownership: ~10.1%
Serves over 14 million people. A major ESG play.
Xylem Inc. (XYL)
A global leader in water treatment technologies.
BlackRock stake: ~10.1%
Recently acquired Evoqua, boosting innovation.
Mueller Water Products (MWA)
Specializes in valves and pipe systems.
BlackRock holds over 8% of the shares.
Poised to benefit from infrastructure stimulus.
California Water Service Group (CWT)
Operates in California and several other states.
BlackRock stake: ~19% (the highest among peers!)
Artesian Resources (ARTNA)
Regional water and wastewater services.
BlackRock stake: ~7.8%
📈 Why Is BlackRock So Bullish on Water Stocks?
💹 Stable, inflation-resistant cash flows
🌱 Strong ESG synergy
🌍 A central player in climate resilience
🏗 Direct beneficiary of U.S. infrastructure policies
Although BlackRock hasn’t acquired full control, their significant minority holdings give them substantial influence over company direction and strategy.
Translation:
BlackRock is aiming for long-term dominance, not short-term profits.
‘Water’ as an inflation hedge asset.
Essential infrastructure in the climate crisis era.
A hybrid portfolio that simultaneously captures ESG & policy benefits.
💡 Final Insight
Water is being called the “new oil.” With valuations still under the radar, following BlackRock’s water play might be a smart move.
👉 Stay ahead by tracking the “water” investment narrative.
Hello, this is Top Trader GeneLog. You can follow the chart-based insights directly on the blog, and live updates on index flow are shared through our real-time broadcast.
VPAR Chart Explanation This is the NASDAQ-100 chart. The circled areas in the past and present are potential short-term trend turning points; consolidation coupled with an upward trend represents a trading entry point. Each chart has its own wave pattern/trend. Following the rebound from the medium-term resistance/supply level mentioned last week, it is now showing a pattern of re-establishing itself on the short-term line. The trading point is focused on checking whether the swing support line at 21,540 is broken through within approximately one week.
The NASDAQ 100 closed the previous session with a strong upward reversal (+2.28%). As of the pre-market, it’s hovering at 21,476 and re-approaching the swing support dotted line at 21,540.
Asian markets closed mixed; Europe slightly weakened with consumer sectors lagging. U.S. futures are tilting bullish, led by tech—suggesting a possible micro-phase reversal in rhythm.
2. ⏱ Alignment View – U.S. Indices in Sync
S&P 500 Futures: +0.2%
NASDAQ 100 Futures: +0.5%
Dow Futures: +0.1%
The rhythm across major indices is synchronized bullish, and NASDAQ 100 is pacing the charge as it tests above key swing trendline zones.
3. 🌀 Rhythm Trap – Sector Rotation Highlights
AI / Semiconductors: Eyeing a new breakout near resistance
Fintech / Consumer: Potential rebound entry from recent dips
Energy / Commodities: Pullback in oil = resistance test ongoing