Cameco’s $60 Breakout – Is the Uranium King Back in Rhythm? Report for Cameco (CCJ.NYS)

#Cameco #CCJ #UraniumStocks #NuclearEnergy #BreakoutAlert #RHYTHMIXReport
#MomentumStocks #EnergyTrend #CamecoAnalysis #StockRhythm

Hello, this is Top Trader Jinlog.
You can explore the full chart and visual content on the blog.
If you’d like consistent analysis, feel free to subscribe or leave a comment.
To receive faster reports, please select the Priority Review option.

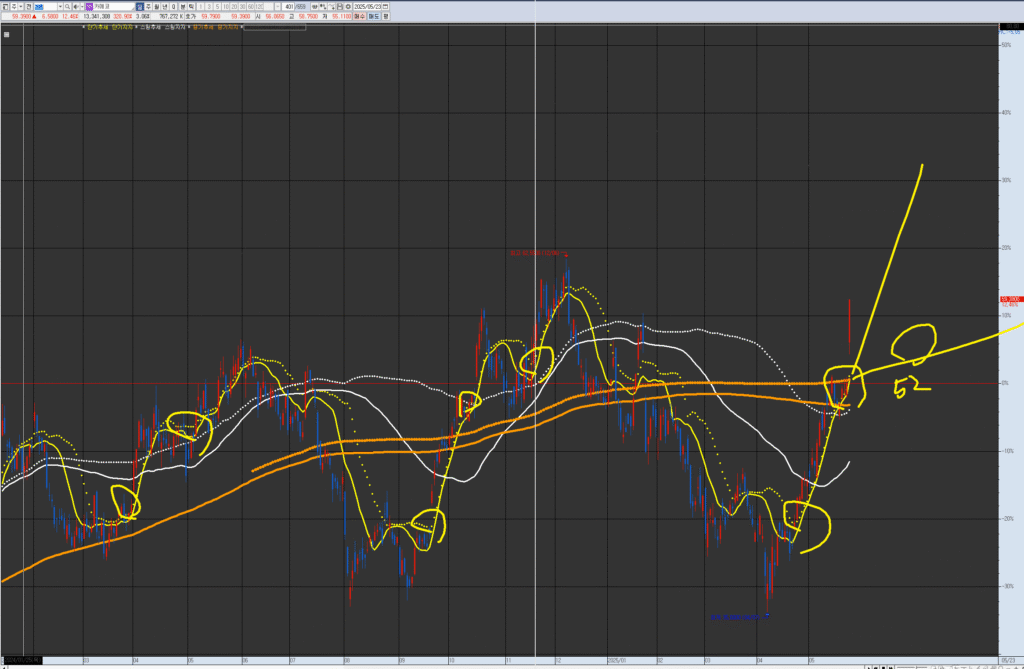
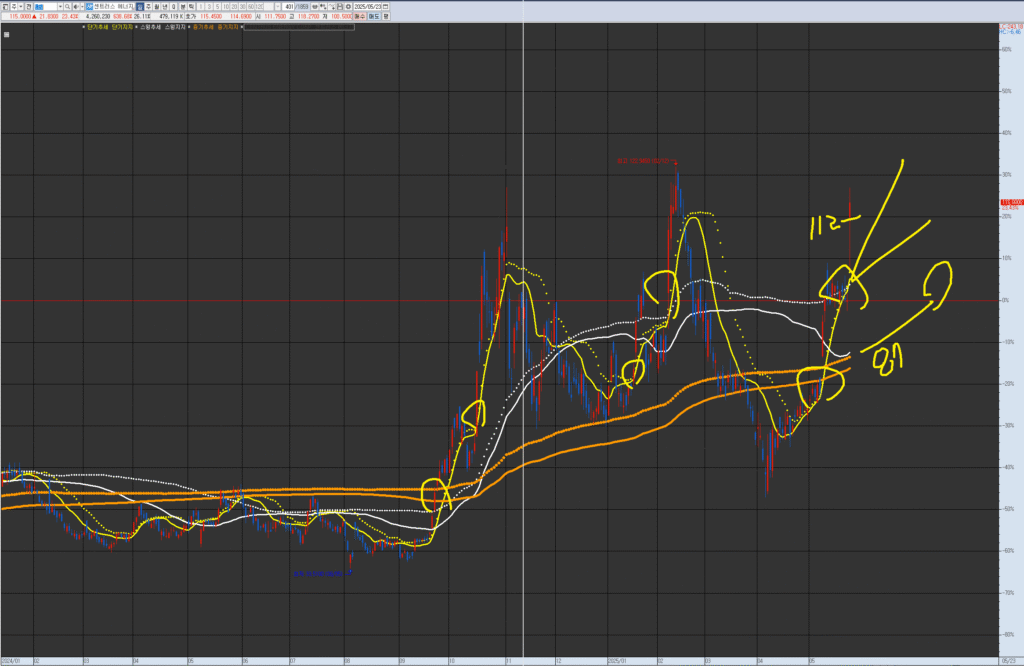
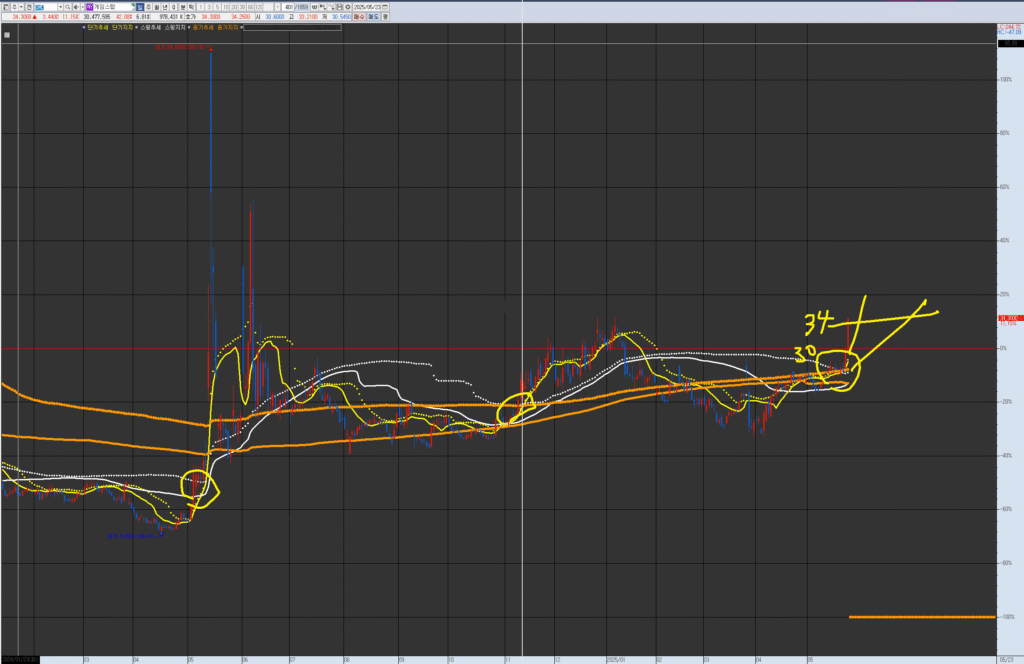
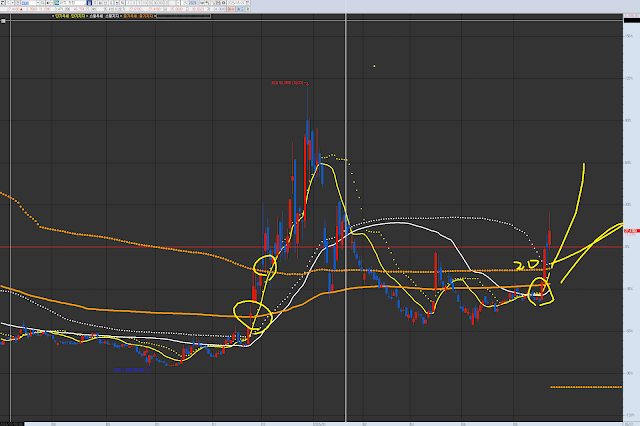
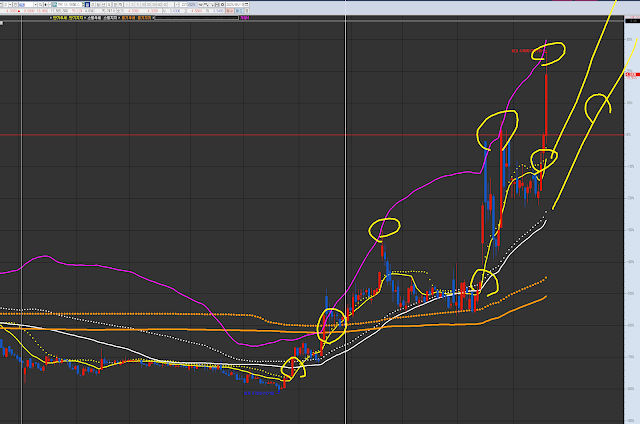
VPAR Chart Explanation This is Cameco (CCJ), as requested for analysis. The circled areas in the past and present are potential short-term trend turning points; consolidation coupled with an upward trend represents a trading entry point. Each chart has its own wave pattern/trend. Currently, there is a gap due to the supply and short-term trend that has broken through the 53 medium-term resistance/support level. However, the minute-chart flow still indicates a remaining trend, so consider buying on a dip near 54.

💡 Investment Opinion

Cameco (CCJ) is one of the strongest names in the uranium sector, and
its breakout above $60 marks a potential transition into long-term trend acceleration.
This is not just a technical move—it’s a rhythm shift backed by macro themes and strong volume.

2-week expected return: +9.6% → $65.00 (Probability: 70%)
2-month expected return: +21.3% → $72.00 (Probability: 62%)
2-year return potential: +48.0% → $88.00 (Probability: 53%)


1. 📌 Summary

Cameco had been trapped in a $35–$50 box range for nearly two years.
Now, after a clean breakout with volume, it’s entering a new rhythm expansion wave.

The Bollinger Bands are expanding, and price has escaped a long-term range.
We are currently observing the early stage of a reacceleration pattern after the breakout.


2. 📈 RHYTHMIX Rhythm Analysis

🔹 Monthly Rhythm

  • Broke out of a 2-year-long consolidation box
  • Rising volume and wider Bollinger bands = higher institutional attention
  • MACD is beginning to curve upwards with price strength above all moving averages

🔹 Weekly Rhythm

  • Retest of core point ($52) confirmed support
  • Clean breakout of dotted resistance ($60+)
  • Two consecutive bullish candles post-breakout signal rhythm continuation

🔹 Daily Rhythm

  • Short and mid-term moving averages are aligned and expanding upward
  • Bollinger dotted top is widening → confirming breakout momentum
  • Current zone $59.5–$60.5 is a natural consolidation area
  • MACD histogram flipped positive + RSI is overbought = possible small pullback before second wave

📌 Core Point ($52): Critical level that converted resistance into support
📌 Dotted Resistance ($60–$63): Minor obstacle before full breakout zone
📌 Trap Watch: Any pullback and reversal from $57–$58 would be rhythmically bullish


3. 📊 Financial Overview

  • Market Cap: $25.5B
  • EPS: $0.57
  • P/E Ratio: 141x
  • Q1 Revenue: $549.6M (+24.4% YoY)
  • Debt-to-Equity: 15.3% → solid and conservative

4. ⚠️ News & Risk Factors

  • Global uranium demand is driving the narrative
  • Despite Q1 earnings miss, revenue is solid and trend remains intact
  • Short-term pullbacks may occur due to RSI overextension or news impact
  • Watch for macro policy shifts or sudden commodity sentiment reversals

5. 🧠 Strategy Scenario (When, Why, How Much)

🎯 Entry Zone

$57.00 ~ $60.00 (Probability: 71%)
→ Strong support near breakout level
→ Bollinger and MA merge zones validate risk-controlled entry

🥅 Targets

  • 1st Target: $65.00 (Probability: 70%)
  • 2nd Target: $72.00 (Probability: 62%)
  • Long-Term Target: $88.00 (Fibonacci extension 1.618 structure)

🛡️ Stop-Loss / Risk Management

$54.80 (Probability: 74%)
→ Below this level, structure weakens and rhythm invalidates


6. 🌈 Outlook

Cameco is rhythmically transitioning from a rebound phase to structural breakout territory.
If consolidation holds and volume doesn’t collapse, this breakout could sustain for weeks or even months.

“Quiet energy always precedes the surge.
The real breakout begins after the silence.”


7. 🧩 Member-Only Deep Dive

📌 Institutional Flow

  • BlackRock, Vanguard have recently increased exposure
  • Nuclear-themed ETFs (URA, NLR) show rising allocations toward CCJ

📌 Short Interest

  • ~3.7% → not high, but may provide short-cover tailwind post-breakout

📌 Social & Trend Insights

  • Reddit mentions for “Cameco” and “Uranium stocks” climbing
  • Trending on X (Twitter): “$CCJ breakout” and “Uranium supercycle”

Centrus Energy: What Comes After the $100 Breakout? Report for Centrus Energy (LEU.AMS),

#CentrusEnergy #LEU #NuclearStocks #BreakoutWatch #RHYTHMIXReport
#UraniumTrend #MomentumStocks #EnergyShift #FibonacciBreakout

Hello, this is Top Trader Jinlog.
You can review the full chart and content visually on the blog.
If you’d like consistent insights, feel free to subscribe or leave a comment.
To receive priority reports faster, select the Priority Review option.

VPAR Chart Explanation This is Centrus Energy (LEU), as requested for analysis. The circled areas in the past and present are potential short-term trend turning points; consolidation coupled with an upward trend represents a trading entry point. Each chart has its own wave pattern/trend. Currently, it is in the process of re-ascending within both medium-term (monthly wave) and short-term (daily wave) trends. Consider trading for further upside if 112 holds as support following a dip (indicated by a lower wick) from the short-term deviation. If it breaks below the short-term line, consider it a potential trading point for a re-ascension after a period of swing accumulation/consolidation within a range above the medium-term resistance/support zone.

💡 Investment Opinion

Centrus Energy (LEU) surged past $100 in a powerful breakout move,
and this is not just a technical push—it marks a new rhythm expansion phase within a broader energy shift narrative.

2-week expected return: +10.4% → $127.00 (Probability: 72%)
2-month expected return: +26.5% → $145.00 (Probability: 63%)
2-year potential return: +64.1% → $188.00 (Probability: 51%)


1. 📌 Summary

LEU has seen over 100% growth recently, entering a 3rd stage of momentum acceleration.
It’s now undergoing a rhythmic pullback-consolidation phase near the $110 level.
If support holds at this “core point” zone, the next Fibonacci extension breakout to $145 becomes increasingly likely.


2. 📈 RHYTHMIX Rhythm Analysis

🔹 Monthly Rhythm

  • Broke out of a long-term compression box.
  • Volume expansion confirms entry into new valuation zone.
  • Strong upside momentum with increasing Bollinger Band spacing.

🔹 Weekly Rhythm

  • Follows the pattern: Compression → Vertical spike → Pullback → Retest
  • Currently stabilizing around the $110 core point.
  • MACD suggests a potential second wave setup after initial exhaustion.

🔹 Daily Rhythm

  • Shows a classic pattern: short-term and mid-term moving averages merged and exploded.
  • Now in a Fibonacci retracement zone (0.382–0.5) with rhythm rebuilding.
  • Dotted-line resistance at $127 is the next breakout trigger, while core support remains around $107–$110.

📌 Core Point ($110): Key support pivot after breakout
📌 Dotted Resistance: $127 marks a rhythm breakout level
📌 Rhythm Trap: Watch for fake breakdown followed by strong intraday reversal (trap entry)


3. 📊 Financial Overview

  • Market Cap: $1.93B
  • EPS: $4.79
  • P/E Ratio: 23.65x
  • Cash Reserves: $470M
  • Debt Ratio: Low — strong liquidity position maintained

4. ⚠️ News & Risk Summary

  • Boosted by U.S. government nuclear policy initiatives
  • Risk lies in sentiment-driven overextension; earnings growth must catch up
  • Pullbacks can be sharp in momentum stocks—watch volume decline with caution

5. 🧠 Strategy Scenario (When, Why, How Much)

🎯 Entry Zone

$109.00 ~ $113.50 (Probability: 72%)
→ Rhythm support zone overlapping with Fibonacci retracement and Bollinger centerline

🥅 Target Zones

  • 1st Target: $127.00 (Probability: 72%)
  • 2nd Target: $145.00 (Probability: 63%)
  • Long-Term Target: $188.00 (Fibonacci extension 1.618 level)

🛡️ Stop-Loss / Risk Control

$105.00 (Probability: 74%)
→ Drop below this key support invalidates the current rhythm wave


6. 🌈 Outlook

Centrus Energy now stands at a rhythmic inflection point.
If this second pullback resolves upward, the wave structure shifts from reversion to expansion continuation.
Nuclear and uranium themes remain hot, but timing the rhythm is key to surfing the wave.

“What coils tightly does so to spring forward.
The second breakout wave always travels further.”


7. 🧩 Member-Only Deep Report

📌 Institutional Flow

  • Vanguard, JP Morgan show recent accumulation
  • ETFs gradually increasing nuclear-related exposure

📌 Short Interest

  • Current short interest: 6.2%
  • Squeeze potential increases above $127 breakout

📌 Trend Sentiment

  • Google Trends: “LEU” +380% over 1 month
  • “Nuclear energy stocks” surging in finance forums & Reddit

GameStop Breakout? What Does the $30 Level Really Mean? Report for GameStop (GME.NYS)

#GameStop #GME #MemeStock #RetailPower #RHYTHMIXReport
#BreakoutStocks #USstocks #RetailInvesting #TrendWatch

Hello, this is Top Trader Jinlog.
You can check the chart and full content on the blog.
If you want regular stock insights, feel free to subscribe or comment.
For quicker delivery, select the priority review option.

VPAR Chart Explanation This is GameStop (GME), as requested for analysis. The circled areas in the past and present are potential short-term trend turning points; consolidation coupled with an upward trend represents a trading entry point. Each chart has its own wave pattern/trend. Currently, it is within a short-term trend (daily wave) within the short-term, swing, and medium-term resistance/support (supply/demand) zones. Consider trading (or entering) on a dip near the short-term line around 27. There is strong resistance/supply between 33 and 36; consider trading if it dips or finds support at these levels.

👋 Intro

Hello, this is Top Trader Jinlog.
You can check the chart and full content on the blog.
If you want regular stock insights, feel free to subscribe or comment.
For quicker delivery, select the priority review option.


💡 Investment Opinion

GameStop (GME), the icon of the 2021 meme stock craze, is showing signs of renewed strength.
The breakout above $30 is more than just a technical bounce—it’s a potential reversal point in rhythm structure.

2-week expected return: +12.3% → $38.50 (Probability: 68%)
2-month expected return: +31.4% → $45.10 (Probability: 54%)
2-year long-term potential: +92.7% → $66.10 (Probability: 48%)


1. 📌 Summary

GME recently broke through the key psychological level of $30,
and is showing similar rhythm patterns to previous surges:
Compression → Breakout → Retracement → Reacceleration.

The current range around $34 appears to be a post-retest consolidation,
offering a chance to re-enter before a broader move unfolds.


2. 📈 RHYTHMIX Rhythm Analysis

🔹 Monthly Rhythm

  • Long-term downtrend has compressed into a tight box.
  • Attempting to escape the upper boundary after base building.

🔹 Weekly Rhythm

  • This is the third rhythmic compression after 2021.
  • Break above the $30 key zone (core point) is being defended.
  • Trend reacceleration is likely if the current support holds.

🔹 Daily Rhythm

  • A familiar setup: consolidation at moving average convergence + re-break of resistance.
  • 3rd attempt at dotted-line breakout, similar to previous explosive moves.
  • Currently forming a compression-expansion setup right above the key support.

📌 Core Point ($30.0): This level acted as a base during the previous surge.
📌 Dotted Resistance Line: Break here could trigger another vertical move.
📌 Merging Structure: Convergence of short-term and mid-term moving averages is strengthening the setup.


3. 📊 Financial Overview

  • Market Cap: $14.7B
  • EPS: $0.265
  • P/E Ratio: 124.36x
  • Cash Reserves: $4.77B
  • Debt: $1.4B (Short-Term) / $2.1B (Long-Term) — stable

4. ⚠️ News & Risks

  • Options Activity Surging: Call volume up 270% week-over-week
  • Retail Hype Return: Reddit, Twitter, and Robinhood mentions skyrocketing
  • Regulatory Risks: Meme stock volatility could trigger SEC scrutiny
  • Valuation Concerns: P/E remains extremely high—susceptible to earnings shocks

5. 🧠 Strategy Scenario (When, Why, How Much)

🎯 Entry Zone

$30.50 ~ $32.20 (Probability: 72%)
→ Solidifying above the core point, where moving averages are converging again

🎯 Targets

  • 1st Target: $38.50 (Probability: 68%)
  • 2nd Target: $45.10 (Probability: 54%)
  • Long-term Target: $48.00–$66.00
    (Aligned with Fibonacci extension 1.618 and social sentiment zone)

🛡️ Stop-Loss / Risk Management

$28.40 (Probability: 76%)
→ Drop below this would negate the current rhythm structure
→ Risk-off zone if volume drops and momentum fades


6. 🌈 Outlook

GameStop is repeating its historic pattern:
Retail sentiment triggers rhythmic compression and vertical expansion.
This $30 breakout may become the first spark in another retail-driven breakout.

“Desire rekindles memory.
And memory adds courage to a moving price.”


7. 🧩 Member-Only Deep Dive

📌 Institutional Flow

  • Net-buying trend resuming from Vanguard, BlackRock, and mid-sized funds
  • Hedge fund sentiment neutralizing after de-risking

📌 Short Interest

  • Current short interest: 17.5%
  • High likelihood of short squeeze tailwinds if resistance breaks

📌 Social Momentum

  • Reddit “GME” mentions up +430% in the past 7 days
  • Robinhood holdings steadily increasing
  • Trending phrase: “GME to $50”

Next-Gen Nuclear Boom? Lightbridge Soars Past $15 — Is the Rally Just Starting? vparReport

 #Lightbridge #LTBR #NuclearEnergy #FusionStocks #CleanTech #EnergyPolicy #USStocks #RHYTHMIXReport

Hello, this is Jinlog.
You can conveniently check the full report with charts on my blog.
If you’d like continuous updates or specific stock coverage, feel free to leave a comment or follow.

VPAR Chart Explanation This is Lightbridge LTBR, requested in the comments. The circled areas in the past and present represent potential entry points for a short-term trend, where consolidation and an uptrend merge. Each chart has wave trends. Based on the medium-term trend (monthly wave), this stock is suitable for medium to long-term investment. It’s currently continuing a short-term trend, so consider targeting it during dips. If it breaks down, the area around 10.15 to 11.5 is a support and a point to consider for trading.

1. Investment Opinion

Lightbridge is gaining significant market attention amid renewed focus on nuclear energy, driven by recent policy developments and its proprietary fuel technology.

  • 2-week return estimate: +18% → $17.95 (Probability: 72%)
  • 2-month return estimate: +36% → $20.75 (Probability: 65%)
  • 1-year return estimate: +115% → $32.75 (Probability: 55%)

2. Summary

Lightbridge has surged following the U.S. Department of Energy’s support announcement for next-gen nuclear fuel development.
The stock has gained over 500% year-to-date, benefiting from its exposure to nuclear, defense, and clean energy themes.
Its recent success with co-extrusion of uranium-zirconium alloy fuel marks a major step toward commercialization.


3. Technical Rhythm Analysis (Monthly to 120-min chart)

  • Monthly Trend: Price has broken above recent highs, attempting to escape a long-term consolidation range.
  • Weekly Trend: Price continues its rally with minimal overhead supply; momentum is strong as rising volume supports extended moves.
  • Daily Trend: The stock remains near recent highs after a strong gap-up, suggesting a short-term overbought condition.
  • 120-Min Trend: A potential pullback may occur near dotted resistance, though a bounce from support could trigger further upside momentum.

4. Financial Overview

  • Cash Reserves: Approx. $56.9M, ensuring short-term financial stability
  • Net Loss: Q1 net loss was $4.8M, up YoY due to higher R&D expenses
  • Debt Ratio: Very low at 1.7%, operating under a virtually debt-free structure
  • Capital Strategy: Filed a $150M mixed-shelf offering to support future funding flexibility and R&D expansion

5. News · Policy · Risk Highlights

  • ✅ May 12, 2025: Q1 earnings call and business update released
  • ✅ Apr 28, 2025: CEO Seth Grae discusses fuel roadmap on Schwab Network
  • ✅ May 6, 2025: EVP Dr. Mushakov joins the U.S. Nuclear Industry Council Board
  • ⚠️ Risk: Still pre-revenue; profitability may take time until full-scale commercialization occurs

6. Strategy Scenario (Entry / Target / Stop-Loss)

Framed by When, Why, and How Much

  • Entry Zone: $14.20–$15.00 (Entry probability: 72%)
  • Targets:
    • $17.95 (Probability: 70%)
    • $20.75 (Probability: 55%)
  • Stop-Loss / Exit:
    • $13.10 breakdown → Partial liquidation to minimize downside risk (Probability: 75%)

7. Outlook

Lightbridge has emerged as one of 2025’s most notable next-gen energy stocks.
Technical progress, policy alignment, and a debt-free capital structure strengthen its investment case.
Although short-term overbought signals are forming, pullbacks may offer buying opportunities.
Commercial rollout of its fuel tech could trigger a second leg of the rally as market anticipation builds.


8. Deep-Dive (Institutional Flow · Short Interest · Upcoming Triggers)

  • Institutional Flow: ~$5M net inflows over the past 3 sessions
  • Short Interest: Relatively low at 1.6%, indicating minimal short squeeze dynamics
  • Catalyst Watch: Key fuel validation test results expected mid-June
  • Policy Monitor: EU/US dual-approval talks could elevate momentum in H2 2025

IonQ Pullback Opportunity? Mid-Term Rhythm in Quantum Leader, Report

#IonQ #QuantumComputing #TechStocks #RHYMIXReport #USMarket #MomentumStock #SwingTrade #TradingRhythm #GrowthEquity

Hi, this is Jinlog.
This RHYTHMIX report analyzes IonQ’s recent breakout and its evolving rhythm structure.
With flexible entry and support zones, we present a mid-term strategy rooted in dynamic rhythm analysis.
Visit our blog for visual charts and request analysis by leaving a comment.

VPAR Chart Explanation This is IONQ, as requested in the comments. The circled areas in the past and present indicate potential entry points for short-term trends, where consolidation and an uptrend merge. Each chart has wave trends. Currently, it is showing the possibility of a short-term trend above the medium-term support/resistance zone. As of today, around the 37 short-term line is a point to consider for trading.

Investment Insight

IonQ shows strong movement post-surge, but has not yet merged with its mid-term trend.
As the short-term rhythm aligns above $35–37, flexible entries with support from volume flow provide
a solid basis for swing trade strategies.

  • 2-week Expected Return: +14% (Prob. 69%)
  • 2-month Expected Return: +32% (Prob. 63%)
  • 1-year Expected Return: +96% (Prob. 55%)

1. Summary

  • Stock soared over 37%, now consolidating
  • CEO likens IonQ to “Nvidia of Quantum”
  • Breakthrough in QEC tech and strategic contracts fueling optimism

2. Technical Rhythm (Monthly to 120-min)

  • Monthly: Pre-breakout expansion rhythm
  • Weekly: Resistance zone ~$48.5 approaching
  • Daily: Key support $35–37, retrace possible
  • 120-min: Box rhythm forming; pullback entry likely

3. Financial Overview

  • Q1 Revenue: $7.6M (+77% YoY), Net Loss: $39.6M
  • FY Outlook: $75M–$95M, CapEx focused
  • Growing R&D and strategic quantum deployments

4. News & Risk

  • ✅ Government contracts and AI logistics tie-ups
  • ⚠️ High PER, consistent net loss
  • 🔍 QEC-AI integration in spotlight

5. Strategy Scenario (Flexible, Zone-Based)

■ Entry Points

  • 1st: $42.80–$43.50 (Short-term pullback)
  • 2nd: $35.00 (Swing support reentry)
  • 3rd: $30.00 (Trend reversal low test)

■ Target Points

  • 🎯 $48.00 (Dotted resistance)
  • 🎯 $54.00 (Mid-term expansion target)

■ Stop/Response

  • ⚠️ Below $29.00 = invalidation of structure
  • ⚠️ MACD weakness + low volume = scale out

6. Emotional Outlook

The flame that pauses burns brighter.
“The true trend belongs not to the first spark,
but to the rhythm that regathers strength.”

Hold steady. Trust the rhythm.


7. Member-Only Report

  • Institutional Flow: $22.3M net buy (5-day)
  • Short Interest: Down to 2.1%
  • Option Sentiment: $50 calls spike – momentum play forming

ARQQ Quantum Surge – A True Breakout or Temporary Buzz? Report

#ARQQ #QuantumSecurity #CyberSecurityStocks #NASDAQ #BreakoutPlay #USStocks #RHYTHMIXReport #MomentumStocks #TechAnalysis #QuantumEncryption

Hi, this is Jinlog.
You can check the full chart visuals on the blog.
For any stock analysis request, feel free to comment or message anytime.

Chart Explanation

Here is the ARQQ Arqit Quantum chart you requested feedback on.

The circled areas in the past and present indicate potential entry points for short-term trends, combining confluence and an upward trend.

Each chart has its own wave and trend patterns.

Currently, there’s a possibility of a shift from a short-term trend to a swing trend, driven by supply breaking through medium-term resistance. This suggests considering a short-term entry now, or a swing trade entry around the $20 mark if the price breaks down.

Investment Opinion

Arqit Quantum is entering a strategic pivot stage with increasing expectations around commercialization of quantum encryption technologies.
From a technical perspective, the stock appears to be exiting a long-term base box, initiating a new rhythm cycle.

  • 2-week expected return: +18.0% (probability: 72%)
  • 2-month expected return: +36.0% (probability: 58%)
  • 1-year expected return: +112.0% (probability: 41%)

1. Summary

  • Following its 2024 earnings report, ARQQ showed a technical rebound driven by optimism surrounding its new recurring revenue model.
  • The price action has remained above the dotted support line for 3+ sessions, indicating possible short-term trend confirmation.
  • From a mid-term perspective, price recovery from base levels is narrowing the gap from previous drawdowns.

2. Technical Rhythm Analysis (Monthly to 120-Minute)

📊 Monthly

  • Long-term downtrend flattening out, forming a potential volume-backed bottoming structure
  • MACD histogram converging at lows, signaling potential bullish decoupling
  • Dotted support still holding, with possible early reversal signals forming

🕰 Weekly

  • First meaningful bullish candle above Bollinger centerline
  • Bollinger band width expanding for 2 straight weeks, often indicating pre-breakout phase
  • Yellow and blue trendlines converging = inflection alignment

📅 Daily

  • Holding above all short-term moving averages and dotted supports for multiple days
  • Bollinger bands opening upward, forming price staircase structure
  • Volume consistency confirms underlying trend strength

⏱ 120-Minute

  • Post-breakout pullback followed by volatility contraction and renewed push
  • MACD crossover into positive zone with rising momentum
  • All short-term EMAs are aligned upward = strong trend signal

3. Financial Flow

  • Revenue declined 54% YoY, but model shifted toward recurring contracts
  • Net losses shrank 45% YoY due to cost restructuring
  • Cash reserves of $18.7M ensure operational viability in near-term

4. News & Risk

  • Signed multiyear enterprise license deal with government clients in EMEA
  • Partnered with Intel and Equus to build first quantum-safe CSfC-compliant architecture
  • Risk: high valuation concerns with 24% weekly volatility
  • Risk: revenue model transition will require time to fully stabilize

5. Trade Strategy Scenario (Entry / Targets / Stop-Loss)

Simplified with When–Why–How Much clarity:

  • Entry Zone ($25.00–$26.50, 72% probability)
    : Converging moving averages and dotted support region = optimal entry
  • Targets
    → $31.00 (hit rate: 70%)
    → $36.50 (hit rate: 55%)
  • Stop-Loss ($23.80, 74% probability)
    : Exit upon failure to hold dotted support, confirming short-term reversal

6. Outlook

ARQQ is entering a breakout pattern both technically and operationally, fueled by government partnerships and critical technology developments.
The recent price pause is more of a volume-supported accumulation, not weakness.
As long as the dotted level holds, the rhythm cycle remains bullish.
This makes the current price zone a risk-reward favorable setup for swing and position traders.


7. Extended Insights (Institutional Flow, Short Interest, Headlines)

  • Institutional Activity: Neutral overall but short-term net buying detected in the last 2 weeks
  • Short Interest: At 6.12%, relatively high – potential for short squeeze risk
  • Headline Summary: Recognized by IDC as a cybersecurity innovator; expanding 5G defense adoption
  • Analyst Opinion: 1 analyst rated “Strong Buy”, 12-month price target: $52.00

GRRR – Is This a Reversal or Just Another Spike? Report #GRRR #GorillaTech

#GRRR #GorillaTech #SmallCapStock #AIstocks #SurveillanceTech #ReversalPlay #TechnicalBreakout #RHYTHMIXReport

Hello, this is Jinlog.
This report provides a comprehensive analysis of Gorilla Technology Group Inc., focusing on technical rhythms, financial health, and strategic outlooks.

Chart Explanation

This is GRRR Gorilla Technology Group, which you requested in the comments.

The circled areas in the past and present show potential short-term trend entry points, where merging trends and an upward trend align.

Each chart has its own wave pattern and trend.

Currently, after the first wave, it is consolidating at the mid-term support/resistance level. Checking for support within approximately two months is needed, or if it further declines near $10, it becomes a consideration point for range trading aimed at a rebound.

📌 Investment Opinion

Gorilla Technology Group Inc. (GRRR) has experienced significant volatility in 2025. After reaching a high of $30.55 in February, the stock has retraced to the $16.86 level. Technical indicators suggest a potential consolidation phase, with the possibility of a reversal if key resistance levels are breached.

  • 2-week expected return: +7.5% (probability: 52%)
  • 2-month expected return: +21.4% (probability: 46%)
  • 1-year expected return: +58% (probability: 62%)

1. Summary

Gorilla Technology specializes in AI-driven security and surveillance solutions. The company has expanded its operations globally, with a presence in Southeast Asia, India, the Middle East, Europe, North America, and Latin America. Despite a net loss in 2024, Gorilla has strengthened its financial position and continues to invest in growth initiatives.


2. Technical Rhythm Analysis

🕰️ Monthly Chart:

  • Significant decline from 2022 highs, followed by a stabilization phase.
  • Formation of a potential base suggests the possibility of a trend reversal.

📉 Weekly Chart:

  • Consolidation within the $15.5–$18.2 range.
  • Momentum indicators (MACD, RSI) show signs of bullish divergence.

📉 Daily Chart:

  • Price action indicates a tightening range, often a precursor to a breakout.
  • Bollinger Bands narrowing, suggesting decreased volatility and potential for a significant move.

⏱️ 120-Minute Chart:

  • Short-term resistance observed around $17.20.
  • Support established near $16.60, providing a defined trading range.

3. Financial Pulse (Ver 6.4)

  • 2024 Revenue: $74.7 million (+15.4% YoY)
  • Net Loss: $63.9 million
  • Cash Position: $37.47 million
  • Total Debt: $21.4 million
  • Total Assets: $153.8 million
  • Equity: $73.1 million

Valuation Metrics:

  • P/E Ratio: N/A (due to net loss)
  • EV/EBITDA: 12.7x
  • ROE: -87%
  • ROA: -41%
  • Liquidity: Adequate, with improved cash reserves

4. News & Risk Summary

  • Strategic Partnerships: Collaboration with Toyota’s logistics division in Thailand to develop smart warehouse solutions.
  • Financial Compliance: Achieved full Sarbanes-Oxley compliance, enhancing financial transparency and governance.
  • Global Expansion: Rapid growth in emerging markets, with a focus on AI infrastructure development.
  • Risks: Continued net losses and market volatility pose challenges; however, improved financial controls mitigate some concerns.

5. Strategic Scenario

  • Entry Zone: $15.80–$16.50
  • Target Prices:
    • $20.50 (short-term)
    • $25.00 (medium-term)
  • Stop-Loss: $14.90

🔮 Outlook

Gorilla Technology is positioned to capitalize on the growing demand for AI-driven security solutions. While financial performance has been challenged, strategic initiatives and global expansion efforts provide a foundation for potential recovery and growth.


🧩 Deep-Dive Insights

  • Institutional Activity: Limited institutional ownership; monitoring for increased interest.
  • Short Interest: Low, reducing the risk of short squeezes.
  • Analyst Ratings: Consensus price target of $31.00, indicating potential upside.

Uber’s Breakout – Real Momentum or a Trap? Report #Uber #Robotaxi

 #Uber #Robotaxi #USstocks #MomentumPlay #BreakoutStock #TechnicalAnalysis #GrowthStock #EarningsSurprise #RHYTHMIXReport

Hello, this is Jinlog.
You can view this full chart and report visually on the blog.
For more reports, feel free to leave comments or subscribe.

Chart Explanation

This is UBER (UBER), which you requested in the comments.

The circled areas in the past and present show potential short-term trend entry points. A confluence of merging trends and an upward trend indicate an entry point.

Each chart has its own wave pattern and trend.

Currently, due to supply and demand tension up to the mid-term trend, if the short-term line is breached, re-entering at the swing line or mid-term trend line is worth considering.

 Investment Opinion

Uber recently broke its 52-week high, supported by strong earnings and institutional confidence.
Momentum is technically strong, but short-term overbought signals and resistance zones must be respected.

  • 2-week expected return: +4.2% (probability: 54%)
  • 2-month expected return: +11.8% (probability: 48%)
  • 1-year expected return: +38.3% (probability: 66%)

1. Summary

Uber is driving a strong rally on the back of robotaxi initiatives, autonomous vehicle partnerships, and Uber Eats expansion.
The sudden swing to profitability, along with institutional buying, signals potential structural upside.


2. Technical Rhythm Analysis

🕰️ Monthly Chart:

  • Broke multi-year resistance (2021–2024 range)
  • Three consecutive bullish candles, top-band expansion forming
  • Setup signals long-term trend reversal confirmed

📉 Weekly Chart:

  • Strong volume breakout past $60
  • All moving averages now in golden cross alignment
  • RSI reaching overbought territory → watch $85–88 zone for pullbacks

📉 Daily Chart:

  • Breakout above $92 after consolidation
  • MACD, CCI remain bullish
  • Price entering prior congestion zone near all-time high → minor resistance likely

⏱️ 120-Minute Chart:

  • Gap-up and tight flag formation
  • Holding upper Bollinger Band → breakout potential in next 2 sessions
  • Minor consolidation still bullish unless $88 breaks

3. Financial Pulse (Ver 6.4 – Updated)

  • 2024 Revenue: $43.98B (+17.96% YoY)
  • Net Income: $9.86B (+422.3% YoY)
  • EPS: $4.56
  • Leverage & liquidity: Stable

➕ Valuation & Ratios

  • P/E (TTM): 16.32
  • Forward P/E: 32.24
  • P/B: 8.80
  • ROE: 60.08%
  • ROA: 21.92%
  • EV/EBITDA: 42.27
  • FCF Yield: Improving post-profitability

4. News & Risk Summary

  • 📌 Bill Ackman’s $2.2B investment via Pershing Square confirms institutional trust
  • 📌 VW ID. Buzz robotaxi pilot in LA starting 2026
  • 📌 New feature release: ‘Savings Slider’, ‘Price Lock’, ‘Route Share’
  • ⚠ Short-term overbought levels, $93–95 zone = potential resistance

5. Strategic Scenario

When · Why · How Much:

  • Entry Zone: $87.5–$89.2 (entry prob: 61%)
    • After minor pullback/consolidation
  • Targets:
    • $97.00 (target prob: 62%)
    • $104.00 (target prob: 48%)
  • Stop-Loss: $83.20 (breakdown prob: 59%)
    • Below $80 = trend failure risk

🔮 Outlook

Uber appears to be transitioning from a growth story to a value + profitability leader.
Short-term volatility may test recent gains, but long-term prospects remain bright.
The ideal approach: scale-in strategy with firm stop at $83 and eyes on breakout toward $100+.


🧩 Deep-Dive Insights (Institutional Flow + Sentiment)

  • Institutional inflow rising post-Q1
  • Retail traders fueling near-term gains
  • RSI/Slow Stoch in overheated territory
  • Analyst consensus price: $106.4
  • Risk-reward remains positive if structure holds above $85

“Tesla’s Rebound – Real Trend Reversal or Just a Fakeout? #Tesla #TSLA #Robotaxi Report

#Tesla #TSLA #Robotaxi #TrendReversal #TechnicalSetup #MACDCrossover #EVStocks #RHYTHMIXReport

Hello, this is Jinlog.
Visit the blog to review full visuals and layered chart analysis.
For more timely updates, feel free to subscribe or leave comments.

Chart Explanation

This is Tesla (TSLA).

The circled areas in the past and present show potential short-term trend entry points. A confluence of merging trends and an upward trend indicates an entry point.

Each chart has its own wave pattern and trend.

In the short-term trend, it is above the mid-term resistance level and near the short-term line, currently in an overbought state. Checking the trend’s support flow is necessary.

 Investment Opinion

Tesla is entering a potential trend reversal phase with short-term momentum showing strong signs of recovery.
Golden cross formations across moving averages and a bullish MACD crossover support the rebound.
However, intermediate resistance remains strong, and any reversal from current levels must be closely monitored.

  • 2-week expected return: +4.5% (probability 56%)
  • 2-month expected return: +12.3% (probability 49%)
  • 1-year expected return: +38.7% (probability 67%)

1. Summary

TSLA has bounced strongly despite weak earnings, supported by robotaxi expectations and energy storage segment growth.
The rebound structure mirrors previous recovery waves, though political risk and insider selling continue to weigh on sentiment.


2. Technical Rhythm Analysis

📊 Daily Chart Analysis

🔹 Structural Setup

  • Recent price movement resembles prior breakout wave (marked by 3 circled zones in chart)
  • Current rebound phase mirrors previous post-correction lift-offs
  • Clean upward alignment of short-term MAs

🔹 Moving Averages

  • 5/10/20-day MA golden cross established
  • 60-day MA breakthrough confirmed
  • Currently testing resistance at 120-day MA

🔹 Indicators

  • MACD histogram crossed above 0 line + signal line → bullish momentum
  • Bollinger Band top expansion underway
  • Minor pullbacks interpreted as healthy shakeouts

3. Financial Pulse

  • Q1 Revenue: $19.3B (-9% YoY)
  • EPS: $0.27 (missed $0.42 est.)
  • Auto revenue down 20%, Energy Storage up 67%
  • Net profit: $850M (-71% YoY)
  • Strong divergence between core auto and energy segments

4. News & Risk Summary

  • Robotaxi service to begin in June in Texas (Model Y based)
  • Political controversy impacts brand image (CA sales down 21%)
  • Ross Gerber & Third Point both sold large Tesla positions
  • Market questioning Elon Musk’s focus

5. Strategic Scenario

When · Why · How Much — summarized:

  • Entry Zone: $330–$336 (entry probability: 63%)
    • Favorable support area post-golden cross
  • Targets:
    • $360 (reach probability: 61%)
    • $388 (reach probability: 43%)
  • Stop-Loss: $316 (breakdown probability: 58%)
    • Below this line, trend reversal may fail

🔮 Outlook

Tesla is entering a potentially explosive rebound phase, backed by technical momentum and growth segments.
However, strong overhead resistance and political noise must be navigated.
The safest approach is staggered entry, close tracking of $316 support, and reassessing near $360–388 levels.


🧩 Deep-Dive Report (Institutional Flow & Sentiment)

  • Institutional inflows returning, short interest retreating
  • RSI nearing overbought — minor pullback expected
  • Elon Musk’s public image continues to affect sentiment

“TMC’s Breakout – Just the Beginning or Overheated Top?” #TMC #DeepSeaMining Report

 #TMC #DeepSeaMining #EnergyTransition #SpeculativeStock #TechnicalBreakout #EnvironmentalImpact #NASDAQ #RHYTHMIXReport

Hello, this is Jinlog.
For full visual context, visit the blog where you can view charts and ongoing breakdowns.
If you’d like continuous updates, feel free to subscribe or leave a comment.

Chart Explanation

This is TMC, which I have mentioned multiple times.

The circled areas in the past and present show potential short-term trend entry points. A confluence of merging trends and an upward trend indicate an entry point.

Each chart has its own wave pattern and trend.

TMC has been consistently maintaining an upward wave in its mid-term trend.

Today, it touched the resistance level in the purple overbought zone. In case of a short-term trend divergence correction or breakdown, the entry point will be near the swing line or mid-term line around $3 again.

Investment Opinion

TMC has experienced a sharp rally driven by expectations around deep-sea mining and recent regulatory moves.
While the momentum is strong, the stock appears overheated, and financial fundamentals remain weak.
Ideal for short-term trades or entry after a healthy pullback.

  • 2-week expected return: +4.2% (probability 49%)
  • 2-month expected return: +16.5% (probability 52%)
  • 1-year expected return: +38% (probability 68%)

1. Summary

TMC skyrocketed over 300% in recent weeks, fueled by application for a U.S. deep-sea mining license, positive environmental assessment news, and a $37M equity raise.
Yet the company still has no revenue, and is navigating early-phase commercialization risks.


2. Technical Rhythm Analysis

🕰️ Monthly Chart:

  • Broke long-term base, signaling structural reversal
  • Mid-term moving averages crossed upward, Bollinger bands expanding
  • RSI and MACD just flipped neutral → bullish setup

📉 Weekly Chart:

  • Explosive breakout beyond mid-term resistance
  • Volume confirms conviction, momentum very strong
  • Approaching top Bollinger zone → near-term overheating

📉 Daily Chart:

  • Gap-ups with full-bodied bullish candles
  • No short-term consolidation — trend acceleration evident
  • MACD histogram peaking → signs of topping

⏱️ 120-Minute Chart:

  • Max overbought; now showing zigzag-style local correction
  • Price clings to upper band → poised for either renewed surge or breakdown
  • Next direction hinges on whether $4.00 zone holds

3. Financial Pulse

  • No revenue; pre-revenue stage business
  • Q1 Net Loss: $20.6M / Cash: $43.8M
  • Recent $37M equity raise at $3.00/share (warrants at $4.50)
  • Operates as a high-risk, high-hype narrative stock

4. News & Risk Summary

  • Filed official U.S. deep-sea mining application
  • Positive environmental assessment triggered +17% gain
  • Analysts (e.g. A.G.P.) raised target to $6.25
  • Still facing backlash from environmental groups + speculative valuation

5. Strategic Scenario

Summarized by When · Why · How Much:

  • Entry Zone: $3.90–$4.20 (Entry Probability: 59%)
    • Post-gap retracement likely to retest support
  • Targets:
    • $5.00 (Reach Probability: 64%)
    • $6.20 (Reach Probability: 42%)
  • Stop-Loss: $3.55 (Breakdown Probability: 60%)
    • Close gap or trend breakdown risk

🔮 Outlook

TMC is a high-volatility bet on the future of energy resource sourcing.
While the technical setup is currently strong, it’s likely nearing exhaustion.
The next optimal entry will likely come after consolidation.
Monitor financial dilution risk and sustainability of momentum.


🧩 Deep-Dive Report (Flow + Sentiment)

  • Strong institutional buying & 5x average volume
  • Buzz rising on Reddit and retail platforms
  • Short interest is high, but less threatening near term
  • Analysts anticipate long-term resource shift
  • Ideal strategy: wait for dips + manage risk on speculative trend