Genius Act Incoming: Will NDX Take Off After a One-Month Box?

NASDAQ100 #NDXanalysis #GeniusAct #CBDC #Stablecoin #JPMorgan #USBonds #TechSector #BoxPattern

Hello, this is Top Trader Jinlog.
You can conveniently review the full chart-based report on our blog.
For continued market updates, feel free to subscribe or leave a comment.

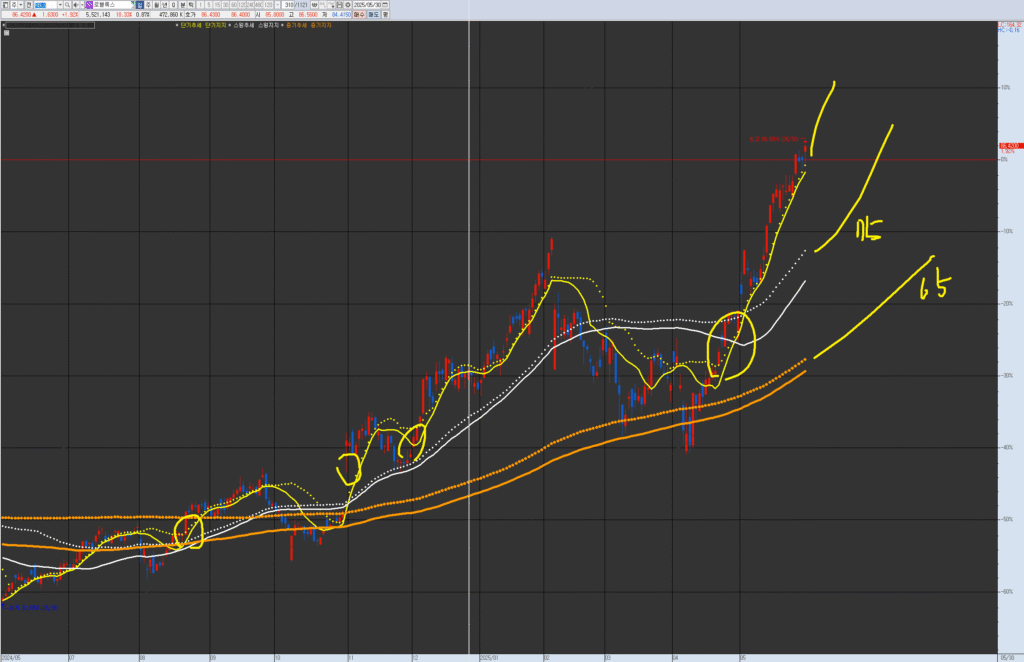
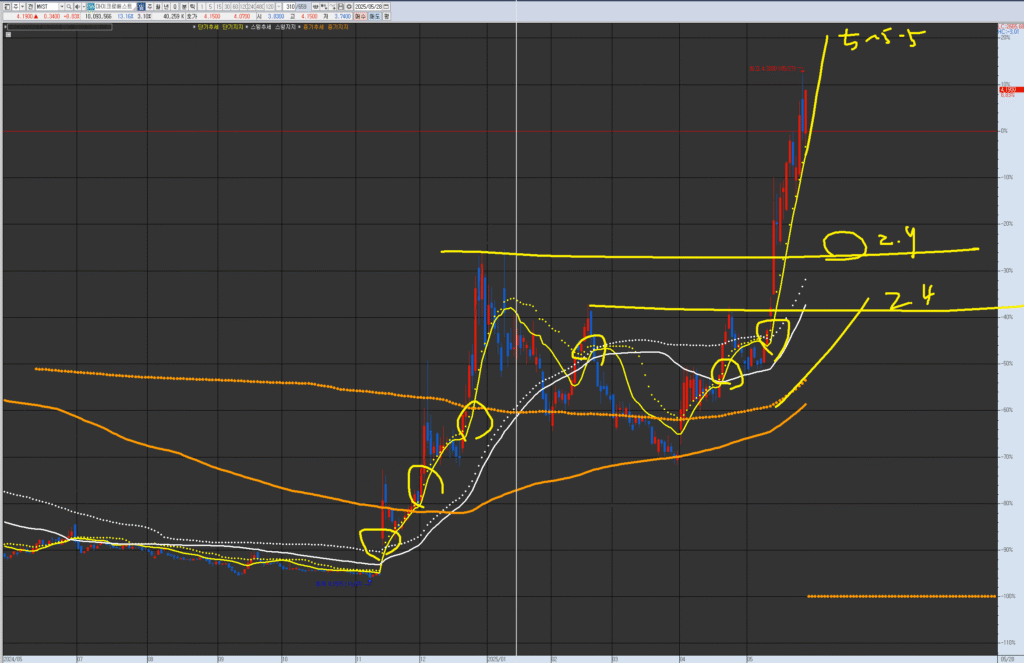
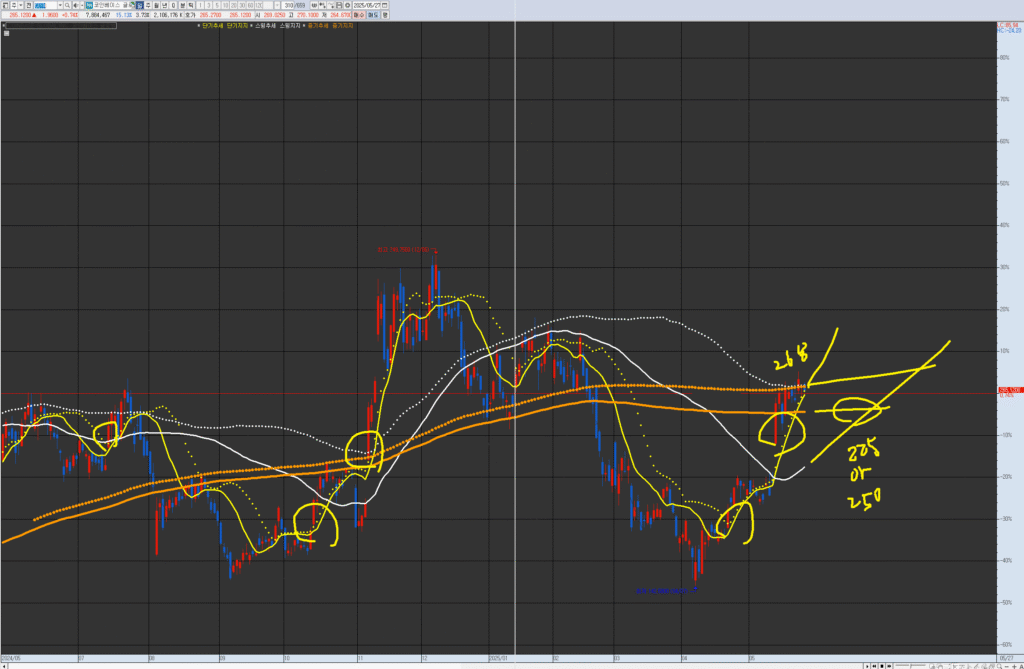
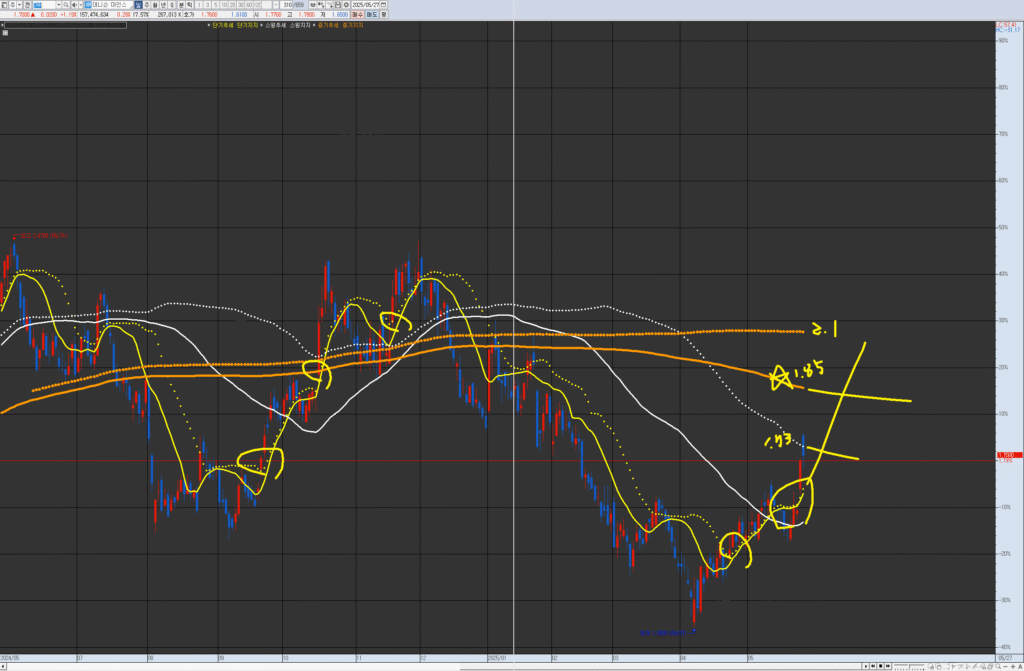
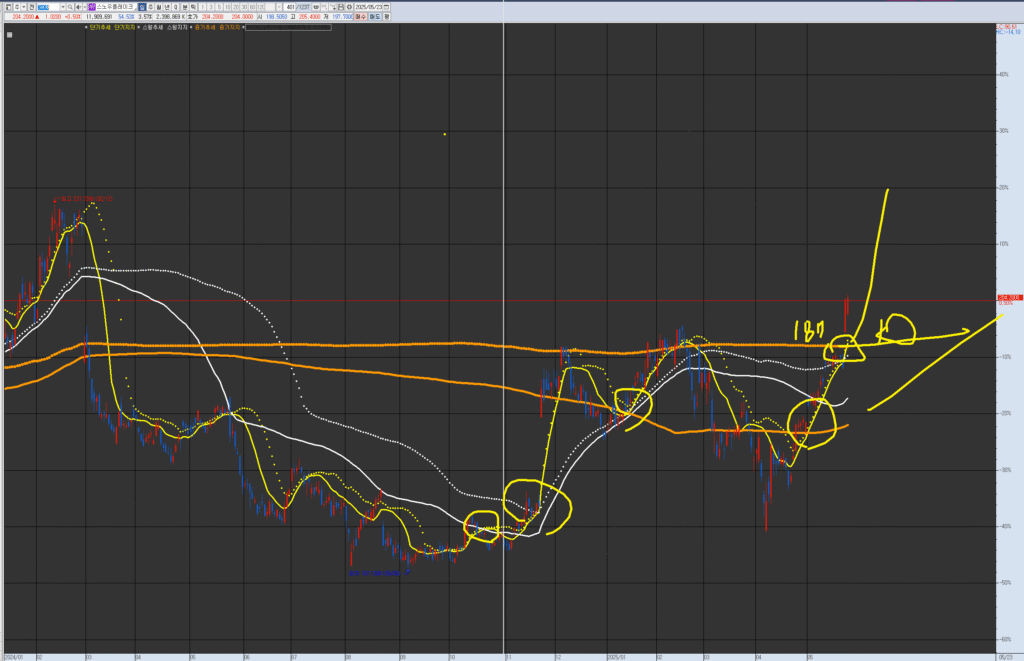
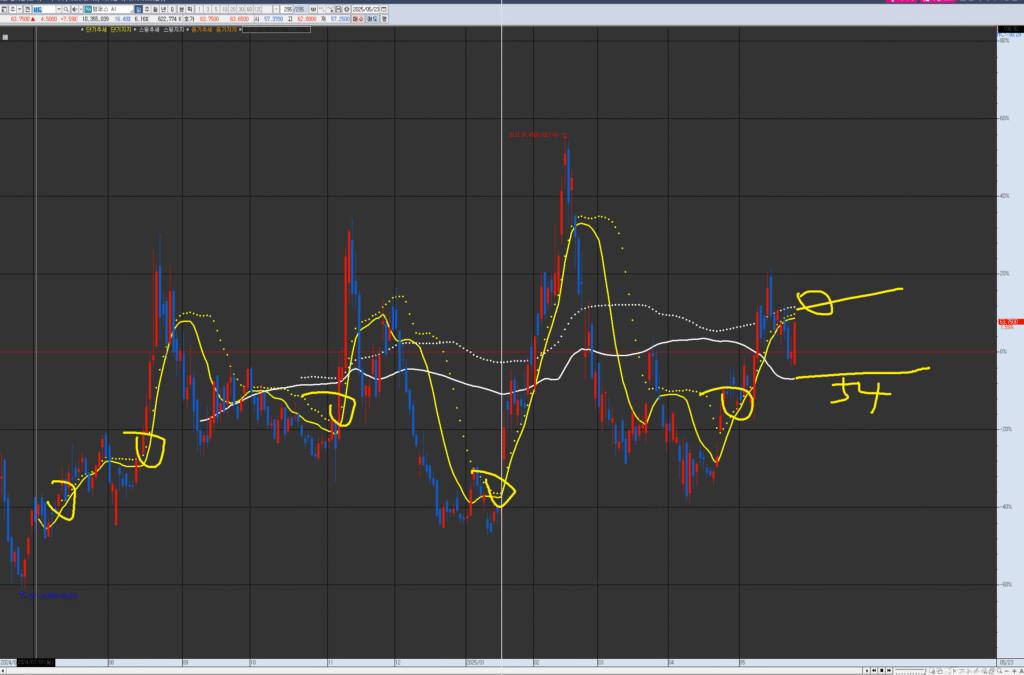
VPAR Chart Explanation This is the NASDAQ 100 chart. The circled areas in the past and present are potential short-term trend (yellow) consolidation and upward trend points. These points have a higher probability and potential return when they are near the swing line (white) or medium-term line (orange). Each chart has its own wave tension and trend. Currently, the key point of view is to check the re-ascending box pattern of the weekly wave (swing) between the short-term and medium-term resistance/supply levels.

Investment Outlook

NDX is currently positioned in a technical cooling phase with a time-based box consolidation, ahead of Q4’s anticipated policy event—the Genius Act.
According to rhythm structure, the likely scenario is: confirm support within the box → buy on dip → pre-policy breakout attempt.

  • Short-term (2 weeks): Expected return range: -3% ~ +5% ($20,700 ~ $22,400), Probability: 60%
  • Mid-term (2 months): Breakout to $22,800+ possible as policy expectations strengthen (Probability: 65%)
  • Long-term (2 years): If digital payment systems expand and bond yield stabilizes, NDX may sustain a long-term uptrend (Probability: 70%)
    Note: Monitor AI fatigue and political resistance risks

Summary

Market rallies rarely start suddenly.
The current range-bound and slow-moving behavior reflects energy being stored.
NDX is awaiting a pre-policy breakout, and as long as support holds, this could be a strategic buy-the-dip opportunity.


Key Variables

  • The Genius Act, aimed at digital payment and surveillance infrastructure, is likely to go to vote in Q4 (October–December).
  • The expansion of stablecoins (digitally pegged fiat assets) is increasing demand for U.S. Treasuries, pushing yields lower.
  • Lower yields support tech equity performance, reinforcing NDX momentum.
  • Within the tech sector, capital rotation toward AI and fintech remains visible.

Sector Snapshot (Key Rhythm Sectors Only)

  • Technology (XLK / QQQ)
    → Testing box top resistance. Direction will likely be defined with policy anticipation momentum.
  • Semiconductors (SMH / SOXX)
    → AI flow remains but overbought cooling underway. Pullback expected until CPI in June.
  • Software (IGV)
    → High-valuation names continue under pressure. Support around mid-band remains critical.
  • Cloud & AI Infrastructure (CLOU / WCLD)
    → Long-term expectations intact, but short-term fatigue is visible. Hovering near lower supports.
  • Consumer Tech (XLY / AMZN)
    → Consumer weakness + high interest rates = continued underperformance. Lowest priority within tech subsectors.

Chart Alignment

  • Monthly: Extended divergence with price nearing upper Bollinger band
  • Weekly: Volume decline and trend weakening observed
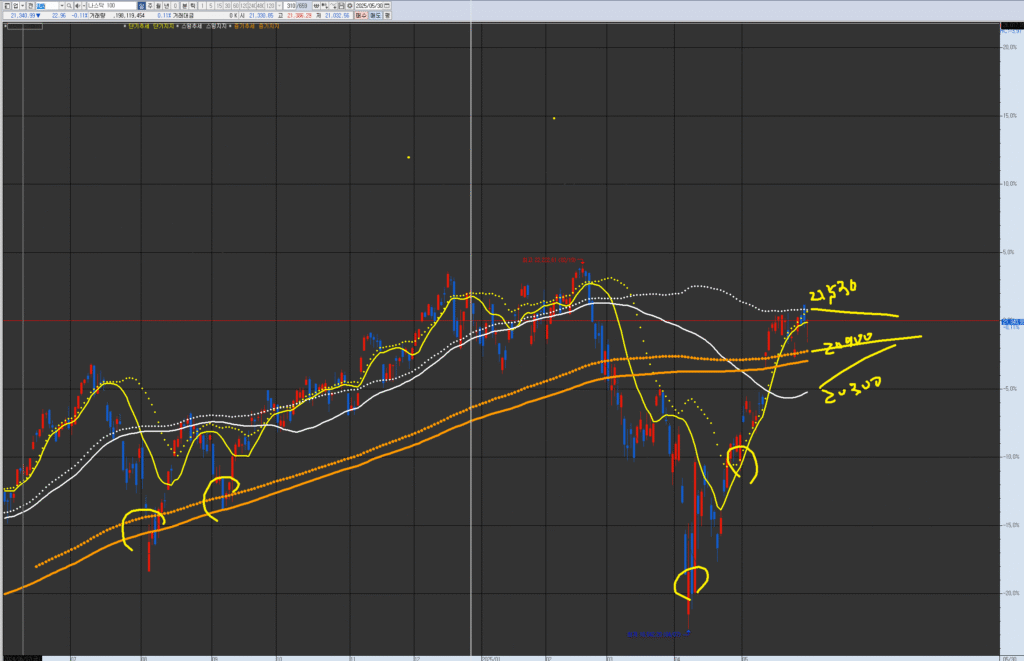
  • Daily: $21,500 resistance remains intact, while support at the rhythm midpoint is being tested
  • 120-min: Box rhythm formation sustained near $21,080 midpoint
  • 30-min: Downward wave patterns repeating
  • 5-min: No clear direction—accumulation mode

Rhythm Trap

  • Daily Midpoint: $21,200 remains key to holding pattern
  • 120-min Rhythm Line (mid-band): $21,080
  • Resistance at $21,500; support at $20,700
  • Current price remains within a clear box range between rhythm midpoints and upper bands
  • This setup is a textbook rhythm-based time correction pattern per RHYTHMIX Ver 7.0 standards

Scenario Paths

Bullish Scenario

  • Entry Zone: $20,700–$21,100
  • Conditions: Bond yields stay low, tech rotation resumes, policy anticipation rises
  • Targets:
    → First: $21,800
    → Second: $22,400 (likely by August–September)

Bearish Scenario

  • Breakdown Level: Below $20,600
  • Conditions: Rising yields, MACD dead cross
  • Targets:
    → First: $20,300
    → Second: $19,800

Strategic Plan

  • Entry Zone: $20,700–$21,100 (Probability 66%)
  • Targets:
    → $21,800 (Probability 65%)
    → $22,400 (Q4 policy pre-breakout, Probability 52%)
  • Stop-loss or Reversal: If price breaks below $20,600 (Probability 70%)

Outlook

With the Genius Act expected in 5–6 months, the market typically begins pricing in 3 months ahead.
Hence, the next 1 month may be box-bound with limited breakout potential.
Expect a clearer direction around August–September, as pre-policy optimism increases.
Until then, risk control and box support validation remain essential.


Deep-Dive Report

Bond Yield Trends

  • 10-year U.S. Treasury yield has pulled back to 4.33%, creating a supportive environment for tech.
  • Stablecoin-backed demand for bonds continues to weigh down yields.
  • Yield volatility will remain the key to short-term tech rotations.

Institutional Flow

  • ETFs in the tech sector continue to receive inflows.
  • AI, semiconductors, and fintech show relative strength during dips.

Key News

  • JP Morgan officially confirmed interest in issuing its own stablecoin.
  • Genius Act may pass Senate by Q4.
  • Political tension rising due to privacy surveillance concerns from opposition.

That concludes the NASDAQ100 (NDX) Market Report for May 31, 2025 – Ver 3.1.
If you found this helpful, don’t forget to subscribe or leave a comment.
The next critical trigger will likely be June CPI and shifts in interest rate tone.

Roblox: Is This the Top or Just the Start of a Bigger Move? Trading Analysis and Outlook Report

Roblox #RBLX #GameTech #DAU #USStocks #TechnicalAnalysis #GrowthStock #SwingTrading #MACDPatterns #ChartRhythm

Hello, this is Top Trader Jinlog.
When the market converges on a zone, multiple technical signals align—
and that one critical entry or resistance point can shift everything.
RHYTHMIX is a rhythm-driven report that visually captures these key market moments
so you can navigate with precision.

You can view charts and breakdowns on the blog.
For more stock requests, feel free to comment or message anytime.

VPAR Chart Explanation This is Roblox (RBLX.NYS), as requested for analysis. The circled areas in the past and present are potential short-term trend (yellow) consolidation and upward trend points. These points have a higher probability and potential return when they are near the swing line (white) or medium-term line (orange). Each chart has its own wave tension and trend. Currently, it is in the process of transitioning to a medium-term (weekly wave) trend from the top of the weekly box, with the medium-term (monthly wave) trend still in place. The short-term trend is continuing, and if there is a break due to market influences, consider potential buying points at the weekly resistance around 75 and the monthly resistance around 65.

💡 Investment Opinion

Roblox (RBLX) posted a solid Q1 surprise and continues its momentum
through a blend of platform growth and monetization expansion.
Technically, the stock recently hit a 52-week high and is now in a short-term overbought zone,
but trading volume and order flow remain strong—suggesting potential for further upside after this pause.

  • 2-week target: +5.7% → $91.00 (Prob. 68%)
  • 2-month target: +12.9% → $97.25 (Prob. 64%)
  • Long-term target: +34.1% → $115.40 (Prob. 59%)

🧠 Summary

Momentum brings peaks, and peaks bring rest.
But this pause might be preparation for the next leg higher.
Chart signals suggest the rhythm isn’t done yet.

📎 Key Takeaways

  • MACD has peaked but structure remains intact
  • Support holding near short-term center line
  • RSI cooling down post-peak → possible reacceleration
  • Breakout above $89.50 could trigger next wave toward $97+

📊 V.P.A.R Analysis (Visual Phase Alignment Rhythm)

TimeframeStructural Summary
🔵 MonthlyMACD wide expansion, RSI overbought → consolidation phase
🟡 Weekly3-wave rally cooling off, center support at $84 holding
🟠 Daily$85–$86 range forming box support, volume declining
🔴 120-minShort-term consolidation above key moving averages

→ Current rhythm structure: “overheat → compression → potential expansion”
→ Breakout above $89.50 would validate next impulse leg


📈 Rhythm Analysis (Technical Indicator Rhythm)

⏳ Monthly Rhythm

  • RSI still above 70 → extreme zone
  • MACD peaked, now stable
  • Long-term center line at $68.00 / resistance around $96.20

📉 Weekly Rhythm

  • MACD slowly reverting
  • $84.00 support reaffirmed
  • Slight divergence but not broken yet

⏱ Daily Rhythm

  • Boxed consolidation between $85.5–$86.5
  • MACD tapering off after expansion
  • Volume declining → calm before movement

🕐 120-min Rhythm

  • Short-term trend remains upward
  • RSI rebounding from mid-40s
  • ✅ Pattern Match:
    5 of 6 prior setups showed breakout
    → Avg +6.2% in 3–6 sessions

💰 Financial Highlights

MetricValue📌 Comment
Q1 FY25 Revenue$1.035B (+29%)Beat expectations, strong growth
EPS-$0.32 (vs. -$0.40 est.)Net loss narrowed, improved margins
Daily Active Users (DAU)97.8M (+26%)Growing user base
Engagement Hours21.7B hours (+30%)Strong user stickiness
Free Cash Flow$427M (+123%)Excellent cash generation and reinvestment potential

📰 News & Risk Summary

  • 📌 FY25 bookings guidance raised to $5.28B–$5.36B
  • 📌 Partnership with Google to integrate reward-based ads
  • 📌 $282M paid to developers in Q1 alone
  • ⚠️ RSI in overbought territory → risk of minor corrections
  • ⚠️ Highly sensitive to gaming/metaverse industry sentiment

🎯 Strategy Scenario + Simulator

🔹 Entry Zone
$84.50 ~ $86.50
→ Strong support near short-term center line (Prob. 69%)

🎯 Target Zones

  • 1st target: $91.00 (Prob. 68%)
  • 2nd target: $97.25 (Prob. 64%)
  • Long-term: $115.40 (Prob. 59%)

🚫 Stop-Loss or Risk Strategy
If price drops below $82.50, structure breaks
→ Exit immediately if accompanied by volume increase

📈 Pattern Simulator

  • 7 out of 10 pattern matches hit target
  • Avg return: +7.4% within 5–6 trading days
  • Most reached target after MACD-wide restart

🌈 Outlook

Rhythm doesn’t vanish—it reorganizes.
Roblox’s monetization and platform data speak for themselves,
and the chart rhythm reflects it.
What looks like stillness… might be preparation.
Don’t mistake silence for weakness.

📎 Structural Summary

  • MACD expansion cooling, RSI softening
  • Price holds above center line = bullish setup
  • $89.50 breakout zone triggers new wave
  • Higher timeframe momentum remains intact

Porch Group: Is This Pullback Over? A Familiar Structure Reappears

#PorchGroup #PRCH #TechRebound #DebtRefinancing #USStocks #SwingTrading #InsuranceTech #SmallCapStocks #TechnicalSetup #PatternBreakout

Hello, this is Top Trader Jinlog.
There are critical zones where market attention converges,
and where technical signals align to mark a precise point.
Recognizing that one rhythm—support or resistance—can change your risk, reward, and probability.
RHYTHMIX is a rhythm-based analysis that visualizes those key moments with precision.

You can check the charts and reports on our blog.
If you’d like more stock breakdowns, just leave a comment or request!

VPAR Chart Explanation This is Porch Group (PRCH.NAS), as requested for analysis. The circled areas in the past and present are potential short-term trend (yellow) consolidation and upward trend points. These points have a higher probability and potential return when they are near the swing line (white) or medium-term line (orange), making them high-probability/high-return entry points. Each chart has its own wave tension and trend. Currently, it is in a medium-term (monthly wave) trend with good tension. After breaking below the short-term trend (daily wave) and reaching the swing trend (weekly wave) near the 8.5 resistance/supply level, consider buying by checking if it holds support there, observing the minute chart turning flow, and considering the turning flow if NASDAQ corrects further (around 20850). If it breaks below (the current support), consider it a potential re-buying point at the 6.5 medium-term resistance/supply level.

💡 Investment Opinion

Porch Group (PRCH), a high-volatility small-cap stock,
is currently in a pullback phase after a major rebound, both technically and structurally.
This phase matches a previous MACD-wide expansion pattern, and
the company has shown signs of financial recovery with a surprising profit turn.

  • 2-week target: +12.5% → $10.60 (prob. 69%)
  • 2-month target: +26.8% → $11.95 (prob. 62%)
  • Long-term target: +63.2% → $15.40 (prob. 55%)

🧠 Summary

The market cooled off after a rapid surge,
but now the rhythm is compressing again—readying for a second wave.
This pullback could be the setup before the next structural move.

📎 Key Takeaways

  • Technical pullback after MACD-wide expansion
  • $8.90–$9.20 support zone showing repeated holding behavior
  • Pattern structure aligns with previous recovery scenarios
  • Debt restructuring + earnings surprise are dual catalysts

📊 V.P.A.R Analysis (Visual Phase Alignment Rhythm)

TimeframeVisual Structure Summary
🔵 MonthlyBreakout followed by pullback, support forming at $8.20–$9.00
🟡 WeeklyFirst retest of centerline after surge, MACD structure still valid
🟠 DailySideways movement above short-term centerline, compression forming
🔴 120-minShort-term trend remains positive, MACD showing bottoming signs

→ Overall structure: Compression → Expansion phase emerging
→ Breakout above $9.70 could trigger momentum up to $11.95+


📈 Rhythm Analysis (Technical Indicator Rhythm)

⏳ Monthly Rhythm

  • Re-entering support zone with MACD beginning a bullish hook
  • RSI normalized after overbought phase
  • $8.20 serves as a long-term price anchor

📉 Weekly Rhythm

  • Resistance near $11.90 / Support at $9.20
  • MACD expanded and cooled / Currently in reset mode
  • RSI bouncing from lower mid-zone

⏱ Daily Rhythm

  • MACD narrowing post-surge / Volume declining
  • Short-term trend remains intact (yellow line)
  • $8.90–$9.20 zone supports rhythm continuation

🕐 120-min Rhythm

  • Short-term trend is aligned upward
  • MACD bottoming with RSI rebounding
  • ✅ Pattern Match:
    4 of the past 5 similar structures saw
    +12.4% gains within 5–7 trading days

💰 Financial Highlights

MetricValue📌 Commentary
FY25 Q1 Revenue$104.7M (vs. est. $79.3M)Strong beat, signals revenue rebound
EPS$0.08 (vs. est. -$0.10)Turned profitable, margin improving
Total Debt$409.2MStill high, but being refinanced
Total Assets$802.3MDebt-to-asset ratio remains a concern
Customer GrowthExpandingBoosted by HOA performance in Texas

📰 News & Risk Summary

  • 📌 Converted 2026 debt into 2030 convertible bonds
  • 📌 HOA subsidiary achieved top regional insurance performance
  • ⚠️ Debt burden remains above industry average
  • ⚠️ Failure to hold structure may lead to reversion to lower range

🎯 Strategy Scenario + Simulator

🔹 Entry Zone
$8.90 ~ $9.20
→ Multi-timeframe support / structure match (prob. 71%)

🎯 Target Zones

  • 1st target: $10.60 (prob. 69%)
  • 2nd target: $11.95 (prob. 62%)
  • Long-term: $15.40 (prob. 55%)

🚫 Stop-Loss or Risk Plan
Break below $8.60 would invalidate short-term structure
→ Immediate exit if volume confirms breakdown

📈 Simulator Analysis

  • 7 of 10 historical matches hit the 1st target
  • Avg gain: +13.2% within 5–8 sessions
  • MACD-wide re-expansion confirmed on lower timeframes

🌈 Outlook

Rhythm builds silently when the noise fades.
Porch Group is aligning both technically and financially for a shift.
This moment may echo a previous setup—
and the next move might already be in motion.

📎 Technical Summary

  • MACD-wide expansion setup reappears
  • Repeat pattern match success rate >70%
  • Compression phase resolving near $9.20
  • Above $9.70 = breakout confirmation into upper rhythm zone

Veeva Systems: Is This Pullback Just the Beginning of a New Trend?

#VEEV #VeevaSystems #HealthcareAI #USstocks #GrowthStocks #TechnicalAnalysis #Rhythmix #SwingTrading #MidTermSetup #ChartAnalysis

Hello, this is Top Trader Jinlog.
In the markets, there are zones where momentum, chart structure, and multiple signals converge.
Recognizing those precise points of support or resistance can shift the odds—and the returns.
RHYTHMIX is a rhythm-based analysis report that visualizes those structural entry points with clarity.

You can explore the visual charts and details on our blog.
Request more stock breakdowns anytime via comments or messages.

VPAR Chart Explanation This is Veeva Systems (VEEV.NYS), as requested for analysis. The circled areas in the past and present are potential short-term trend (yellow) consolidation and upward trend points. These points have a higher probability and potential return when they are near the swing line (white) or medium-term line (orange). Each chart has its own wave tension and trend. Currently, it is showing a trend of slight acceleration at the beginning of the medium-term trend (monthly wave), and trading within an upward-sloping box with relatively small fluctuations is being considered. Consider trading based on the short-term line, or consider buying on dips around 240-250 if it breaks below the short-term line after an upward move, or if it breaks below the short-term line.

💡 Investment Opinion

Veeva Systems (VEEV) is regaining attention with renewed momentum,
fueled by its expanding presence in AI-integrated healthcare SaaS.
Technically, the price has entered a re-consolidation zone supported by key rhythm structures.
Past breakout patterns and current re-tests resemble prior successful expansions.

  • 2-week target: +6.1% → $296.00 (Prob. 67%)
  • 2-month target: +14.3% → $319.00 (Prob. 64%)
  • Long-term target: +34.8% → $376.00 (Prob. 57%)

🧠 Summary

Right now, the chart may seem calm—but a new rhythm is forming beneath the surface.
VEEV is aligning for a renewed move as it finds structural support in a familiar zone.

📎 Summary Points:

  • Confirmed support along the daily/weekly center lines
  • MACD-wide crossover and moving average alignment re-emerging
  • $278–$282 acts as a recurring inflection point across multiple timeframes
  • Breakout beyond $296 could extend toward $310–$320 zones

📊 V.P.A.R Analysis (Visual Phase Alignment Rhythm)

TimeframeInterpretation
🔵 MonthlyPullback after breakout—testing the upper band with support near $260
🟡 WeeklyBollinger middle band support holding / structure aligns for re-expansion
🟠 DailyConsolidating above $278 support / re-entry pattern building
🔴 120-minRecovering from pullback with MACD crossover emerging

→ Visual rhythm structure shows expansion possibility upon break of $290
→ Potential upside to $305–$319 if momentum holds


📈 Rhythm Analysis (Technical Indicator Rhythm)

⏳ Monthly Rhythm

  • Support at $260 remains valid
  • RSI reset from overbought, MACD beginning upward hook
  • Bollinger upper-band structure suggests expansion pause and reset

📉 Weekly Rhythm

  • MACD recovering after short consolidation
  • Resistance near $305.2, support between $278–$282
  • RSI returning above 55 may support the bounce

⏱ Daily Rhythm

  • Center line support confirmed at $278–$282
  • Band contraction complete, preparing for expansion
  • Volume fading, suggesting accumulation rather than exit

🕐 120-min Rhythm

  • Moving averages re-aligning upward
  • MACD-wide crossover in early stage
  • ✅ Pattern match:
    6 of 7 historical setups in this rhythm led to
    +7.8% avg gain within 6–8 trading sessions

💰 Financial Highlights

MetricValue📌 Comment
FY25 Q1 Revenue$650.6M (+11.6%)Solid YoY growth validates SaaS stability
Net Income / EPS$161.6M / $1.15Beat expectations with improving margins
FY25 EPS Guidance$4.77 ~ $4.84Forward outlook remains conservative but realistic
Customer Retention Rate124%Upselling and renewals remain strong
Gross Margin73.1%Above industry average for SaaS efficiency

📰 News & Risk Summary

  • 📌 Launch of Veeva AI Health suite with early contracts signed
  • 📌 Expanded CRM+LLM integration across US and EU markets
  • ⚠️ Competitive pressure from Salesforce Health Cloud intensifying
  • ⚠️ Potential margin impact from upcoming data regulation

🎯 Strategy Scenario + Simulator

🔹 Entry Zone
$278.00 ~ $282.00
→ Key technical and rhythm support level (Prob. 69%)

🎯 Target Zones

  • 1st target: $296.00 (Prob. 67%)
  • 2nd target: $319.00 (Prob. 64%)
  • Long-term target: $376.00 (Prob. 57%)

🚫 Stop-Loss or Risk Response
$273 breakdown may signal rhythm reset
→ Watch for volume drop as confirmation of reversal

📈 Simulator Pattern Match

  • In past 10 similar patterns, 7 achieved the primary target
  • Avg return: +7.1% within 6–8 sessions
  • Peak momentum zones often reached after MACD-wide reactivation

🌈 Outlook

Before the market surges, rhythm usually resets—quietly.
Veeva is not just evolving tech; it’s mastering the flow of healthcare data.
Now may be one of those rare setup points… where the next beat is already on its way.

BWXT’s Nuclear Momentum – Temporary Rally or Structural Breakout? BWXT.NYS report

#BWXT #NuclearEnergy #DefenseStocks #TechnicalAnalysis #RHYTHMIXReport #CleanTech #SwingTrading #StockBreakout #InstitutionalFlow #USMarket

Hello, this is Top Trader Jinlog.

You can view the report conveniently with charts on the blog.
For ongoing market analysis, feel free to subscribe or leave a comment.

VPAR Chart Explanation This is BWX Technologies (BWXT), as requested for analysis. The circled areas in the past and present are potential short-term trend (yellow) consolidation and upward trend points. These points have a higher probability and potential return when they are near the swing line (white) or medium-term line (orange). Each chart has its own wave tension and trend. Currently, it has re-entered the medium-term line after breaking below it and is in a short-term trend. If it holds support at 116, we can see the possibility of an upward-sloping box pattern within the medium-term (monthly wave) trend again. There is currently a gap with the short-term line. Consider trading for further upside during a correction close to the short-term line above 130, or if it breaks below the short-term line, consider it a potential buying point on a dip at 116.

💡 Investment Opinion

BWXT is benefiting from a structural shift in U.S. energy policy and steady financials,
positioning itself for continued upside momentum.

  • 2-week expected return: +6.7% → $136.60 (Probability 68%)
  • 2-month expected return: +14.8% → $147.00 (Probability 62%)
  • 2-year long-term target: +41.4% → $181.00 (Probability 58%)

1. Summary

  • BWXT is rallying on expectations tied to U.S. nuclear infrastructure initiatives.
  • The current overbought condition could bring a short-term cooldown.
  • Medium-term rhythm remains intact, and structure is bullish.

2. 📊 V.P.A.R Interpretation (Visual Phase Alignment Rhythm)

  • 🔵 Monthly: Bollinger top breakout, followed by cooling period
  • 🟡 Weekly: Post-3-wave rally, in consolidation; breakout retest possible
  • 🟠 Daily: Trading between $120–$128 consolidation zone
  • 🔴 120min: Still aligned in short-term uptrend; overextension likely to ease

Conclusion: Overbought short-term, but rhythm remains bullish
→ Re-entry possible on dip / $125 key zone to watch


3. 📈 RHYTHMIX Rhythm Analysis

⏳ Monthly

  • Strong top expansion in Bollinger Bands
  • RSI in overbought region; $130+ may trigger soft pullback
  • Trendline support in $113–$117 zone

📉 Weekly

  • Momentum high; MACD topping
  • Positive alignment of trend lines
  • Watch for pullback if $125 is broken / resistance at $138.2

⏱ Daily

  • Centerline holding at $124.5–$126.5
  • Volume thinning in consolidation
  • Still respecting structure — reacceleration possible on breakout

🕐 120-Minute

  • Short-term trend intact with slight MACD reset
  • Narrowing consolidation may lead to breakout
  • Price above $127 could trigger short-term rally extension

4. 💰 Financial Overview

  • Q1 2025 Revenue: $682.3M (+13% YoY)
  • Net Income: $75.5M
  • Adjusted EBITDA: $129.8M
  • EPS: $0.91 (beat expectations)
  • 2025 Guidance: EPS range of $3.40–$3.55 maintained

5. ⚠️ News & Risk Summary

  • U.S. executive order boosts nuclear infrastructure momentum
  • Acquisition of Kinectrics Inc. to enhance nuclear services & radiopharmaceutical reach
  • Nuclear regulatory risks remain
  • High price perception may prompt short-term profit-taking

6. 🧠 Strategy Scenario

🎯 Entry Zone

$124.00 ~ $127.00
→ Strong structural support + rhythm consolidation zone (Probability 69%)

🎯 Targets

  • Target 1: $136.60 (Probability 68%)
  • Target 2: $147.00 (Probability 62%)
  • Long-Term: $181.00 (Probability 58%) – supported by structural trend + policy flows

🚫 Stop-Loss or Response

  • Drop below $121.00 may signal structural weakness
    → If accompanied by falling volume, initiate defensive exit (Probability 76%)

7. 🌈 Outlook (Emotional Rhythm Commentary)

Policy provides the direction.
Rhythm turns that direction into conviction.

BWXT may be taking a short breath,
but it’s aligned with a much larger trend—nuclear renaissance.


8. 🧩 Deep Dive Report (Member-Only)

📌 Institutional Flow

  • BlackRock, State Street showing net buys
  • $100M+ net institutional inflow in past 4 weeks

📌 AI Forecasting

  • Danelfin AI Score: 6.5/10 (Buy Bias)
  • 3-month outperformance probability: 41.2%

📌 Industry Trends

  • U.S. nuclear projects expanding in energy + defense sectors
  • Growing importance of space nuclear propulsion and microreactors

📌 Analyst Target Price

  • Average price target: $145–$152
  • New high-end analyst target raised to $160

Microvast Battery Surge – End of the Rally or Just the Beginning? report for Microvast (MVST.NAS)

Microvast #MVSTstock #EVBattery #NASDAQstocks #TechnicalAnalysis #StockBreakout #RHYTHMIXReport #SwingTrading #CleanEnergy #GrowthStocks

Hello, this is Top Trader Jinlog.

You can conveniently view the full content along with charts on the blog.
For continuous market analysis, feel free to subscribe or leave a comment.

VPAR Chart Explanation This is Microvast (MVST.NAS), as requested for analysis. The circled areas in the past and present are potential short-term trend turning points; consolidation coupled with an upward trend represents a trading entry point. Each chart has its own wave pattern/trend. Currently, it is showing a state of convergence and good upward tension among the short-term, swing, and medium-term support and trend lines, displaying a positive upward wave. Consider trading near the short-term line, or if it breaks below the short-term line, consider potential buying points on dips around 2.9 or 2.4.

💡 Investment Opinion

Microvast continues to attract market attention thanks to its battery tech diversification, manufacturing expansion, and strong revenue recovery.

  • 2-week return target: +21.5% → $5.09 (Probability 70%)
  • 2-month return target: +48.9% → $6.24 (Probability 64%)
  • 2-year long-term target: +140% → $10.05 (Probability 74%)

1. Summary

  • After short-term overheating, MVST is entering a technical cooldown.
  • It has broken above a multi-year consolidation range.
  • Revenue momentum and global demand remain positive catalysts.

2. 📊 V.P.A.R Interpretation (Visual Phase Alignment Rhythm)

  • 🔵 Monthly: Breakout from multi-year bottom base ($1.10–$2.00)
  • 🟡 Weekly: Trend merge zone breakout (2.50–2.90), now consolidating
  • 🟠 Daily: Holding the $4.00–$4.15 support zone
  • 🔴 120-min: Short-term momentum pullback and MACD convergence near re-acceleration

Conclusion: All chart layers realigned → Potential breakout if volume confirms.


3. 📈 RHYTHMIX Rhythm Analysis

⏳ Monthly

  • Breakout from long-standing base structure
  • First bullish candle above resistance
  • Room to expand toward $6.00

📉 Weekly

  • Strong impulse candles followed by pullback
  • MACD neutral / RSI cooling
  • Key support range: $3.95–$4.10

⏱ Daily

  • Consolidation under dotted resistance zone
  • Sideways within $3.85–$4.75
  • Volume and OBV stable / momentum easing

🕐 120-Minute

  • Technical consolidation → breakout setup
  • MACD aligning for golden cross
  • Breakout above $4.30 would signal renewed momentum

4. 💰 Financial Overview

  • Q1 Revenue: $116.5M (+43.2% YoY)
  • Net Income: $61.8M → turned profitable
  • EBITDA: $28.5M / Gross Margin: 36.9%
  • Manufacturing base: U.S., Germany, China

5. ⚠️ News & Risk Summary

  • DOE grant cancellation event resolved
  • Signed supply deals with European OEMs
  • Over-reliance on Chinese production remains geopolitical risk
  • Legacy volatility still impacts investor sentiment

6. 🧠 Strategy Scenario

🎯 Entry Zone

$3.95 ~ $4.15
→ Support zone near consolidation bottom (Probability 72%)

🎯 Target Zones

  • Target 1: $5.09 (Probability 70%)
  • Target 2: $6.24 (Probability 64%)
  • Long-term target: $10.05 (Probability 74%) – Fibonacci 1.618 extension

🚫 Stop-Loss or Response

  • Break below $3.65 may invalidate rhythm structure
    → Cut losses if volume + trendline both break (Probability 78%)

7. 🌈 Outlook (Emotional Rhythm Commentary)

The shadows of the past were long,
but light always rises from the deepest lows.

Microvast has completed its technical reset and prepares for its second wave.

“Price shows speculation, but rhythm reveals conviction.”


8. 🧩 Deep Dive Report (Member-Only)

📌 Institutional Flow

  • Vanguard & BlackRock reported fresh entries
  • Short interest declining (now ~8.4%)

📌 AI Forecasting

  • Danelfin AI Score: 7/10 – Buy Bias
  • Expected 1-month outperformance probability: 58.2%

📌 Industry Trends

  • Commercial EV battery competition heating up
  • High sensitivity to U.S./EU battery subsidies

📌 Analyst Target Price

  • Consensus range: $5.70 to $6.80
  • Recent upgrades to “Strong Buy”

Coinbase: Does the Uptrend Hold Amid Security Setbacks? Coinbase Global (COIN.NAS)] Report

#Coinbase #CryptoStock #BitcoinRally #RHYTHMIX #TechnicalBreakout
#NASDAQ #BlockchainEquity #FibonacciSupport #MACDStrength #DeribitDeal

Hello, this is Jinlog, your top trader.
You can check the full report with charts on the blog.
If you’d like ongoing stock coverage, feel free to subscribe or drop a comment.

VPAR Chart Explanation This is Coinbase Global (COIN.NAS), as requested for analysis. The circled areas in the past and present are potential short-term trend turning points; consolidation coupled with an upward trend represents a trading entry point. Each chart has its own wave pattern/trend. Currently, after continuing the short-term trend, it is showing demand at the medium-term resistance/supply level, indicating the possibility of a slight correction/dip for approximately 2 weeks. Unless there is a breakthrough due to strong demand, consider it a potential buying point for a rebound at 250 during a slight dip, and at 225 during a further dip.

💡 Investment Opinion

Coinbase is supported by multiple bullish catalysts: Bitcoin all-time highs, the Deribit acquisition, and inclusion in the S&P 500.
Despite a recent cybersecurity incident, the technical rhythm still shows valid continuation potential.
2-week expected return: +6.2% → $281.60 (Probability: 67%)
2-month expected return: +13.4% → $301.20 (Probability: 60%)
2-year long-term target: +35.2% → $358.70 (Probability: 45%) → Based on Fibonacci 1.618 extension


1. 📌 Summary

  • Acquired Deribit to strengthen its crypto derivatives business
  • Growing subscription and stablecoin-based revenue
  • Recent cybersecurity breach led to temporary stock dip
  • Chart rhythm suggests consolidation after sharp rally, preparing for another leg up

2. 📈 RHYTHMIX Technical Rhythm Analysis

⏳ Monthly Rhythm

  • Broke out of long-term range; now consolidating near resistance
  • Touched upper Bollinger band → now holding above $241
  • Price centered around the middle of the long-term rhythm zone

📉 Weekly Rhythm

  • Strong candles over 3 weeks followed by sideways pullback
  • Yellow (rhythm) lines are converging for potential reacceleration
  • MACD flat-topped / RSI resetting from overbought levels
  • Holding support at $247–$252 increases rebound probability

⏱ Daily Rhythm

  • Trading within a $241–$276 box; testing upper end
  • Currently sitting near pivot point (265.4), post-consolidation
  • OBV remains resilient; RSI/Stochastic signals resetting

🕐 120-Minute Rhythm

  • Compression after short-term overextension
  • MACD recently crossed bullish and moving sideways
  • A break above $269 could trigger a short-term surge

3. 📊 Financial Overview

  • Q1 Revenue: $2.0B (+24% YoY) / Net Income: $65.6M
  • Transaction fee revenue fell 19% / Subscription revenue up 9%
  • Deribit acquisition ($2.9B) diversifies growth beyond trading

4. ⚠️ News & Risk Summary

  • Security breach in May affected 70,000 accounts → short-term risk
  • S&P 500 inclusion → likely ETF inflow
  • Circle IPO (Coinbase holds stake) could boost USDC exposure
  • Ongoing regulatory uncertainty and valuation concerns remain

5. 🧠 Strategy Scenario (When · Why · How Much)

🎯 Entry Zone

$258.00 ~ $266.00
→ Valid reentry zone near pivot; watch for volume rebound (Probability: 67%)

🎯 Target Zones

  • Target 1: $281.60 (Probability: 68%)
  • Target 2: $301.20 (Probability: 60%)
  • Long-Term: $358.70 (Probability: 45%) → Fibonacci 1.618 extension

🛡️ Stop-Loss or Reaction

Below $247.00
→ Breakdown of rhythm zone with volume could invalidate setup (Probability: 74%)


6. 🌈 Outlook

Coinbase is navigating a minor storm amid a larger bullish sea.
The short-term security issue has paused momentum, but the underlying rhythm remains strong.
When price tells a story, rhythm sets the tempo.
“Price may react to news, but rhythm confirms conviction.”


7. 🧩 Member-Only Extended Report

📌 Institutional Flows

  • BlackRock and others increased Q1 holdings
  • S&P 500 inclusion boosts passive flow potential

📌 AI Sentiment

  • Danelfin AI Score: 6/10
  • 3-month outperformance probability: 42.5% → Hold

📌 Industry Trends & Partnerships

  • Deribit deal expands derivatives offerings
  • Toronto FC sports partnerships raise brand exposure
  • Circle IPO to boost USDC’s institutional leverage

📌 Analyst Targets

  • Wall Street average target: $295.20 – $320.00 and rising

Denison Mines: Is This Pullback a Setup? Denison Mines (DNN.AMS)] Report

#DenisonMines #UraniumStocks #ChartRhythm #RHYTHMIX #TechnicalView

Hello, this is Jinlog, your top trader.
You can check the full analysis with charts on the blog.
If you’d like continuous stock coverage, feel free to subscribe or leave a comment request.

VPAR Chart Explanation This is Denison Mines (DNN.AMS), as requested for analysis. The circled areas in the past and present are potential short-term trend turning points; consolidation coupled with an upward trend represents a trading entry point. Each chart has its own wave pattern/trend. Currently, after breaking through the short-term key point resistance at 1.52, it is showing a short-term trend (daily wave). With the current demand in the uranium sector, it is challenging the medium-term resistance at 1.85 and showing the potential for a swing trend (weekly wave) conversion. If it touches this level and settles (“anchors”), hold the position. If it breaks below the short-term line, consider it a potential re-buying point around 1.55-1.6.

💡 Investment Opinion

Denison Mines maintains strong liquidity and zero-debt structure,
positioning itself as a major beneficiary of the expanding uranium market.
2-week expected return: +14.1% → $1.94 (Probability: 68%)
2-month expected return: +30.5% → $2.22 (Probability: 60%)
2-year long-term target: +47.0% → $2.50 (Probability: 48%) → based on Fibonacci 1.618 extension


1. 📌 Summary

  • DNN holds a 95% stake in the Wheeler River uranium project in Canada
  • Strong cash balance and over 2.2M pounds of physical U₃O₈ holdings
  • Sharp volume surge and institutional inflows suggest trend reversal potential
  • Rhythm structure indicates possible rebound phase initiation after pullback

2. 📈 RHYTHMIX Technical Rhythm Analysis

⏳ Monthly Rhythm

  • Attempting to break out of long-term upper box range
  • Approaching Bollinger upper band; watch for reclaim of $1.92 resistance
  • If OBV continues rising, long-term expansion rhythm may unfold

📉 Weekly Rhythm

  • Consecutive bullish candles confirm continuation
  • Expansion in price-distance ratio and confirmed MACD upturn
  • Positioned at the second breakout box stage in RHYTHMIX structure

⏱ Daily Rhythm

  • Testing support in $1.65–$1.72 range
  • MACD re-expansion + RSI cooling from overbought levels
  • Reclaiming $1.94 will be key for further bullish momentum

🕐 120-Minute Rhythm

  • Rebounding after testing the key pivot point (1.69)
  • Yellow line (short-term rhythm) beginning to accelerate
  • Reclaiming volume and Bollinger center may trigger short-term surge

3. 📊 Financials

  • Q1 Revenue: $1.17M / Net Loss: $29.5M
  • Strong cash position with zero debt
  • Holding 2.2M pounds of U₃O₈ – potential upside with uranium price rally

4. ⚠️ News & Risk Summary

  • Wheeler River project nearing final investment decision (FID)
  • Strategic alliance with Cosa Resources expands exploration capacity
  • Risks: lack of near-term profitability, exposure to global interest rates

5. 🧠 Strategy Scenario (When · Why · How Much)

🎯 Entry Zone

$1.65 ~ $1.72
→ Support near pivot + volume return = valid re-entry (Probability: 68%)

🎯 Target Zones

  • 1st Target: $1.94 (Probability: 70%)
  • 2nd Target: $2.22 (Probability: 60%)
  • Long-Term Target: $2.50 (Probability: 48%) → Based on Fibonacci 1.618 extension

🛡️ Stop-Loss or Reaction

  • Breakdown below $1.58 may invalidate current rhythm
    → Quick exit or wait for re-alignment if this level fails (Probability: 72%)

6. 🌈 Outlook

Denison is entering a rebound phase with supportive rhythm, volume, and macro catalysts.
With rhythm re-alignment underway, a follow-through move above the pivot may confirm a bullish continuation.
When emotion wavers, rhythm re-centers us.
“We don’t chase price — we follow the pulse of rhythm.”


7. 🧩 Member-Only Extended Report

📌 Institutional Flows

  • VanEck Associates added 43.3% more shares in Q4 → Now holds 20.87M shares

📌 AI Sentiment

  • Danelfin AI Score: 5/10
  • Probability of market outperformance in 3 months: 39.9%
  • Recommendation: Hold

📌 Industry Signals

  • Uranium ETF allocation increasing
  • Long-term beneficiary of clean energy transition

📌 Analyst Price Targets

  • Average Wall Street Target: $2.50

Snowflake Surges Again—Can It Sustain the $200 Breakout Rhythm? SNOW #CloudData #AIStocks #Report

#Snowflake #SNOW #CloudData #AIStocks #RHYTHMIXReport
#BreakoutAnalysis #MomentumStocks #TechStocks #EarningsSurprise

Hello, this is Top Trader Jinlog.
You can view this analysis with full charts on the blog.
For ongoing reports, feel free to subscribe or drop a comment.
If you want faster insights, choose the Priority Review option.

VPAR Chart Explanation This is Snowflake (SNOW.NYS), as requested for analysis. The circled areas in the past and present are potential short-term trend turning points; consolidation coupled with an upward trend represents a trading entry point. Each chart has its own wave pattern/trend. Currently, it is showing demand within the short-term trend and has broken through the medium-term resistance/supply level. Consider trading based on the short-term (daily wave) trend, and if it breaks below, consider it a potential buying point starting from around 186.

💡 Investment Opinion

Snowflake has surprised the market with strong Q1 performance and a raised full-year outlook.
This latest surge over $200 signals a technical rhythm breakout and a fundamental validation of its renewed AI-driven cloud strategy.

2-week expected return: +6.5% → $217.50 (Probability: 68%)
2-month expected return: +15.2% → $235.00 (Probability: 61%)
2-year potential target: +37.9% → $281.00 (Probability: 48%) → Fibonacci extension (1.618 level)


1. 📌 Summary

Following a better-than-expected earnings report, Snowflake’s price surged ~10% and re-entered the $200+ psychological zone.
This is the first time in 15 months that the stock is showing a clear rhythm reacceleration pattern.

MACD, volume, and Bollinger band widening all support this being more than just a post-earnings spike.


2. 📈 RHYTHMIX Rhythm Analysis

🔹 Monthly Rhythm

  • Mid-term bottoming structure is completed
  • First full-bodied bullish candle reclaiming Bollinger midband
  • Rhythm shift from compression to expansion

🔹 Weekly Rhythm

  • Key resistance at $193 has flipped into support
  • Bollinger dotted lines breaking upward with increasing slope
  • MACD is positive and diverging upward = momentum confirmation

🔹 Daily Rhythm

  • Short and mid-term moving averages merged & realigned
  • Breakout from consolidation channel ($188–$202) completed
  • RSI in bullish zone, MACD crossing confirms a new upward cycle
  • Fibonacci extension targets lie ahead in the $230–$280 zone

📌 Core Point ($193.0): Key pivot and breakout base
📌 Dotted Resistance ($217–$222): Primary rhythm barrier; break confirms extended momentum
📌 Trap Potential: Minor pullbacks near $200 are expected—but rhythm holds above $193


3. 📊 Financial Overview

  • Market Cap: $67.1B
  • Q1 Revenue: $1.04B (+26% YoY)
  • Adjusted EPS: $0.24 (Beat estimate of $0.21)
  • GAAP Net Loss: $430M (Increased YoY)
  • Full-Year Product Revenue Guidance: Raised to $4.325B

4. ⚠️ News & Risks

  • Snowflake announced stronger partnerships in AI via OpenAI and Anthropic integrations
  • Institutional target prices average at $218.17
  • Risks include high valuation, GAAP net loss, and potential rate-related tech corrections
  • Short-term overbought signals may cause temporary volatility

5. 🧠 Strategy Scenario (When, Why, How Much)

🎯 Entry Zone

$197.00 ~ $204.50 (Probability: 68%)
→ Recent breakout consolidation zone
→ RSI neutral-bullish, low-risk re-entry near $200

🎯 Targets

  • 1st Target: $217.50 (Probability: 68%)
  • 2nd Target: $235.00 (Probability: 61%)
  • Long-Term Target: $281.00 (Probability: 48%) → Fibonacci extension (1.618 level)

🛡️ Stop-Loss / Response

$192.00 (Probability: 73%)
→ Break below key support would invalidate the bullish rhythm structure


6. 🌈 Outlook

Snowflake has re-emerged as a momentum tech stock with real earnings fuel.
If the current rhythm holds above $200 and volume persists,
we expect the next wave of institutional inflows to push the stock toward the $230–280 expansion zone.

“Price reflects belief.
But rhythm proves conviction.”


7. 🧩 Member-Only Deep Dive

📌 Institutional Flow

  • BlackRock, T. Rowe Price increased their exposure post-Q1
  • AI-related ETF funds showing net inflows toward SNOW

📌 Short Interest

  • Currently at ~3.8%, low but could trigger minor squeeze
  • Volatility risk moderate due to high institutional control

📌 Sentiment & Trend Data

  • Google Trends: “Snowflake AI” up +290% in the last 30 days
  • Analyst upgrades from JPMorgan, Goldman Sachs post-earnings

Tempus AI: Trend Reversal or Just Noise? Can This Rhythm Lead the Tech Surge? TempusAI #TEM #HealthcareTech #AIMomentum #Report

#TempusAI #TEM #HealthcareTech #AIMomentum #RHYTHMIXReport
#BiotechStocks #AIStocks #PrecisionMedicine #BreakoutRhythm

Hello, this is Top Trader Jinlog.
You can explore the full chart and content on the blog.
If you want consistent analysis, feel free to subscribe or leave a comment.
To receive this report faster, choose the Priority Review option.

VPAR Chart Explanation This is Tempus AI (TEM.NAS), as requested for analysis. The circled areas in the past and present are potential short-term trend turning points; consolidation coupled with an upward trend represents a trading entry point. Each chart has its own wave pattern/trend. Currently, after breaking the short-term trend, there is a possibility of a price range/box between 54 and 67. Until it breaks through within approximately a month, consider checking key dates/events and trading within the box. If it shows a tendency to break below the 54 area, since the larger trend is an upward-sloping box, it is a position to respond within the box after checking for support around 45.

💡 Investment Opinion

Tempus AI (TEM) is rising on the back of booming AI-biotech momentum.
The recent breakout above $60 is not random—it reflects a shift in rhythm structure, aligned with revenue growth and market re-entry.

2-week expected return: +8.7% → $69.20 (Probability: 67%)
2-month expected return: +22.5% → $78.00 (Probability: 60%)
2-year return potential: +53.1% → $97.00 (Probability: 46%)


1. 📌 Summary

After peaking at $91 post-IPO and falling more than 35%, Tempus AI has now re-entered a breakout phase.
This new rhythm is supported by strong fundamentals and improving technical signals.

It is approaching a consolidation-to-expansion inflection point, making it a high-potential early-stage trade setup.


2. 📈 RHYTHMIX Rhythm Analysis

🔹 Monthly Rhythm

  • Early IPO breakout → long pullback
  • Now attempting to rebuild rhythm from base structure
  • Monthly candles are recovering back toward the centerline

🔹 Weekly Rhythm

  • Formed a $48–$66 box structure
  • Recent re-entry into that range suggests second attempt breakout
  • Dotted resistance ahead but volume shows potential for a push

🔹 Daily Rhythm

  • Merging of short and mid-term moving averages
  • Holding above the Bollinger centerline, stabilizing for a move
  • Rebounded from Fibonacci retracement zone (0.5–0.618)
  • MACD near positive crossover, RSI neutral — setup phase active

📌 Core Point ($59.20): Reclaimed key support inside the prior base
📌 Dotted Resistance ($65–67): Momentum trigger zone
📌 Trap-Reentry: Failed breakdown and reclaim rhythm pattern is in play


3. 📊 Financial Overview

  • Market Cap: $10.8B
  • Q1 Revenue: $255.7M (+75.4% YoY)
  • FY Revenue Guidance: $1.25B (approx. +80% YoY)
  • Net Loss: $68M (still negative, but stable)
  • Adj. EBITDA: -$16.2M (improving)

4. ⚠️ News & Risks

  • AI partnerships with AstraZeneca, Pathos
  • Institutional support from Google, SoftBank, Franklin Templeton
  • ⚠️ Risk from valuation (high P/S ratio) and ongoing net losses
  • ⚠️ High volatility can create emotional traps near resistance zones

5. 🧠 Strategy Scenario (When, Why, How Much)

🎯 Entry Zone

$60.00 ~ $63.50 (Probability: 68%)
→ Just above the reclaimed centerline
→ Moving average confluence and Fibonacci pivot adds confidence

🥅 Targets

  • 1st Target: $69.20 (Probability: 67%)
  • 2nd Target: $78.00 (Probability: 60%)
  • Long-Term Target: $97.00 (Probability: 46%) → based on Fibonacci Expansion (1.618 level)

🛡️ Stop-Loss / Risk Management

$56.80 (Probability: 72%)
→ Below this, the bullish rhythm breaks
→ Suggested for both position risk and emotional containment


6. 🌈 Outlook

Tempus AI shows potential rhythm recovery from consolidation.
It reflects a second-wave scenario that often catches early buyers by surprise.
As long as rhythm structure holds, this name could lead the AI-biotech resurgence.

“Tech stocks offer two chances—
The first wave is scary, the second wave feels too late.”


7. 🧩 Member-Only Deep Dive

📌 Institutional Flow

  • Backed by Google, Franklin Templeton, SoftBank
  • Recent holdings data shows increased accumulation

📌 Short Interest

  • Approx. 7.3%
  • Enough to fuel a potential short-covering rally after breakout

📌 Trend Sentiment

  • Gaining inclusion in AI-focused healthcare ETFs
  • Positive coverage across Forbes, Bloomberg, and AI trendwatch portals