Regarding Coinbase, following an algorithm-based flow and appropriate supply and demand, it touched the swing trendline and then had a breakout.
For Tesla, after breaking below the short-term line, there was a gap down, and it’s currently trading sideways below the medium-term line. Within the next two weeks, we should also consider a scenario of re-establishing support after further pullbacks and review it later.
If you look at the chart flow of these two stocks, stocks that are ‘set up’ show a rhythm cycle flow at wave support/resistance levels. So, targeting these stocks when trading can aim for a high win rate.
If you look at the rhythm cycle of the stocks I’ve posted about over the past 2 weeks to 2 months, it will help you target patterns with a high success rate.
Hello, this is TopTrader Jinlog. This report provides a rhythm-based analysis for Applied Digital (APLD) using our RHYTHMIX system. We also offer a podcast in a talk-show format for easier understanding, and a full visual post is available on our blog. If you want timely delivery, priority requests are available. Subscribe or comment for continuous updates.
1️⃣ Summary
APLD recently broke below its short-term rhythm line and is now consolidating near the swing-level support zone. The stock surged after securing a 15-year AI/HPC lease contract with CoreWeave, but is now stabilizing. This creates a potential rhythm recovery scenario, especially if MACD alignment confirms bottoming. Price / Forecast / Target analysis indicates a possible short-term rebound is taking shape.
→ Strategic rhythm re-entry based on consolidation near swing support → Long-term upside remains strong due to structural demand in AI data infrastructure
3️⃣ VPAR Rhythm Analysis
Current Rhythm Zone: Near swing support band (daily swing support visible)
Rhythm flow is transitioning from compression to potential recovery
Swing Supply (MACD): Still under downward pressure but signs of easing
Watch for breakout over $12.70–$13.30 to confirm expansion phase
All rhythm analysis is based solely on rhythm lines visibly displayed on the chart. If no lines are visible, rhythm interpretation is omitted by default. Rhythm flow is evaluated using the natural pattern: compression → recovery → expansion.
4️⃣ Financial Snapshot
FY2024 Revenue: $165.6M (YoY growth +199%)
Recent quarter: Revenue $52.9M / Net loss –$36.1M
Growth fueled by high-scale AI/HPC data center contracts
Capital expansion funded via SMBC loan and preferred equity
Financial recovery hinges on revenue realization and margin improvement
5️⃣ News & Risk Summary
Major Catalysts:
15-year, 250MW AI data center lease with CoreWeave
$5B preferred equity agreement with Macquarie ($900M upfront)
Risks:
Delayed revenue realization
Persistent net losses and capital-heavy expansion
Market Sentiment:
+103% weekly spike after CoreWeave announcement
High retail interest in AI/HPC exposure
6️⃣ Strategy Scenario
🎯 Entry Zones
Short-Term Buy Zone
Price: $10.80 ~ $11.30
Condition: Trap resolution + MACD convergence
Box period: 5–9 trading days
Target: Based on 2-week target ($13.33)
Swing Buy Zone
Price: $9.90 ~ $10.50
Condition: Swing support hold + recovery signal
Box period: 6–12 trading days
Target: Linked to 2-month target ($15.44)
Mid-Term Buy Zone
Price: $8.80 ~ $9.40
Condition: Long-term rhythm recovery after breakdown
Box period: 10–20 trading days
Target: Linked to long-term target ($18.74)
All entries must be based on visible rhythm convergence + MACD confirmation.
7️⃣ Forecast
APLD Stock Forecast
Structural momentum from AI infrastructure investments
Rhythm flow may shift into recovery above swing support
MACD and RSI show signs of potential bottoming
Expansion scenario becomes active if short-term resistance breaks
8️⃣ Advanced Analysis
Institutional Flow: Net buying over past 5 sessions
Short Interest: Approx. 10–12%, with short-covering bursts
Community Signals: High volume on Reddit/X AI-related topics
AI Trading Flow: Algorithmic activity detected on daily bounce zones
✅ Brand
This report is based on the RHYTHMIX rhythm analysis system developed by TopTrader Jinlog. All interpretations are rhythm-based and technical in nature, and do not constitute financial advice.
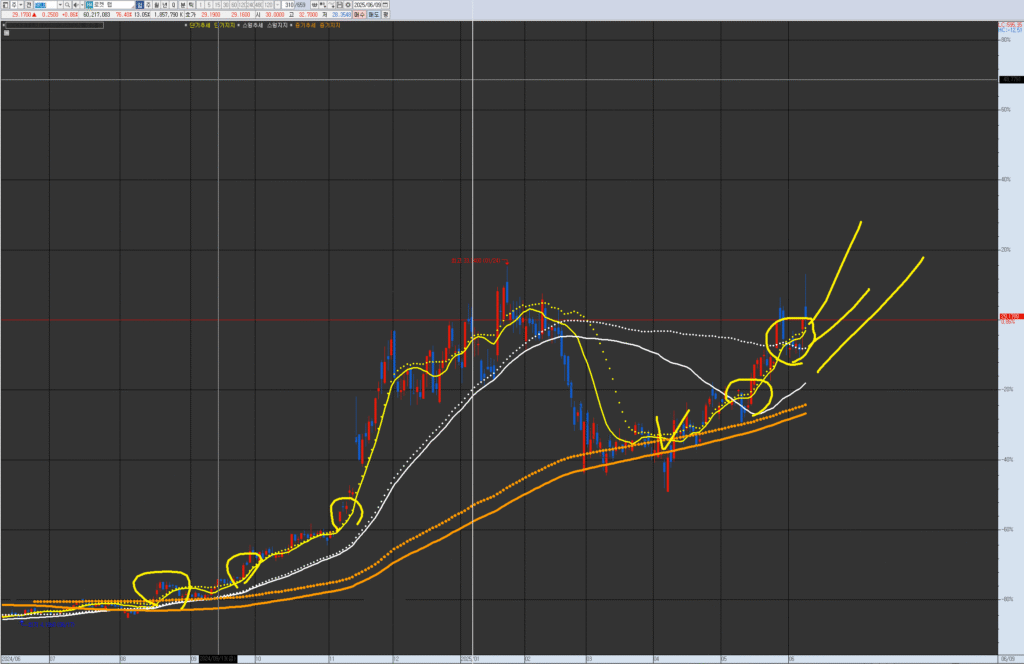
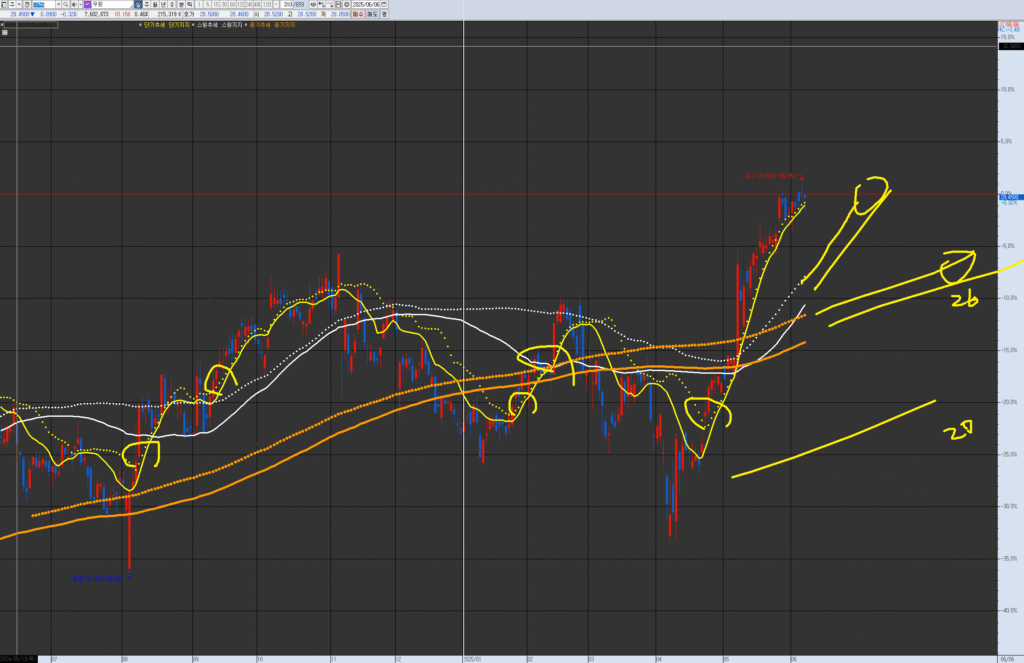
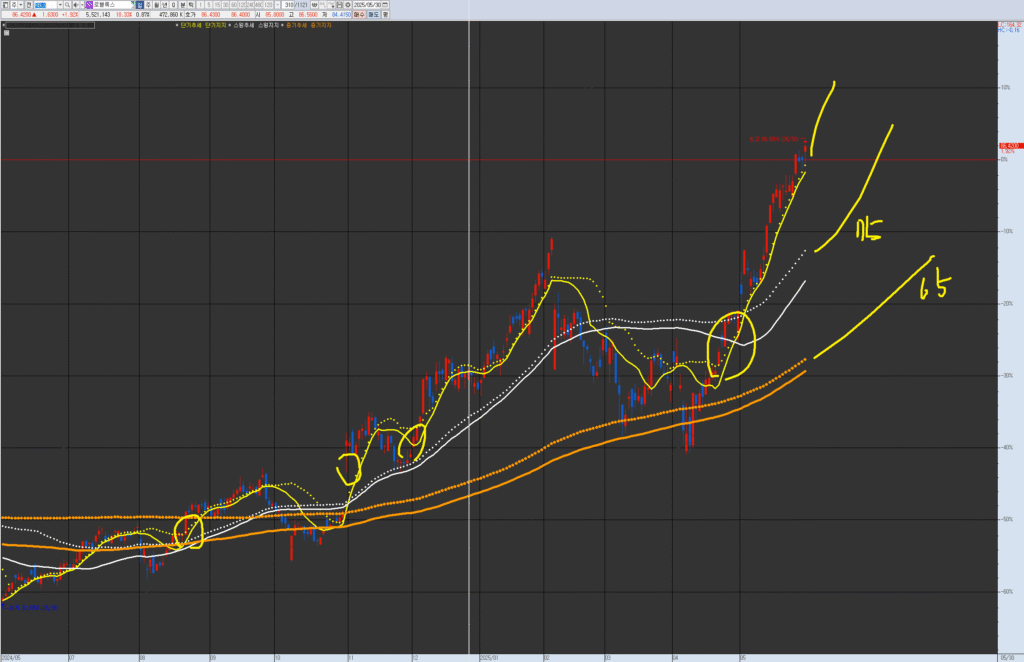
[As of 2025/06/10~11 Closing — Strategy Scenario Update]
🎯 Entry (2~3 Tiered Entry Strategy)
Short-term demand zone (near box centerline): → Around $27.00 ~ $27.50 → Valid for first entry → Currently closed around $27.65 → entering box centerline retest zone
Swing demand zone (swing trendline + center convergence zone): → Around $26.20 ~ $26.80 → Second entry zone → Matches lower convergence of monthly/weekly swing trendline (BW 0.5 / 1 merge zone)
Mid-term demand zone (response if breaking below mid-box center): → Around $25.50 ~ $25.80 → Consider third entry (positioning for deeper pullback)
🎯 Targets (with probabilities %)
2-week Target: → Around $30.50 → Attempt to reclaim upper box level / 65% probability
2-month Target: → Around $34.85 → Scenario for retesting mid-term box top / 70% probability
2-year Long-term Target: → Around $62.00 → Long-term target in case of extended rhythm expansion across monthly/annual trend / 75% probability
🚫 Stop-Loss / Position Adjustment Strategy
If short-term demand zone $27.00 breaks below: → Reduce short-term position or partially exit first entry
If swing demand zone $26.20 breaks below: → Reduce swing position or exit swing entry
If mid-term demand zone $25.50 breaks below: → Fully exit mid-term position
👉 Summary: Currently retesting box centerline → First entry remains valid Additional positioning possible at $26.80 / $25.50 zones upon further pullback Annual/monthly rhythm suggests potential for continued expansion during 2025 → $62.00 long-term target remains valid.
Hello, this is TopTrader Jinlog. You can check the details along with the chart on my blog. If you want continuous analysis, please subscribe or leave a comment. If you want to receive reports quickly, please choose the priority option.
2️⃣ Summary
✅ What breakout/ breakdown triggers should we watch for in this rhythm analysis? Let’s check below.
RKLB recently surged on UAS & Drone Policy momentum and is currently consolidating after a strong breakout. Chart analysis:
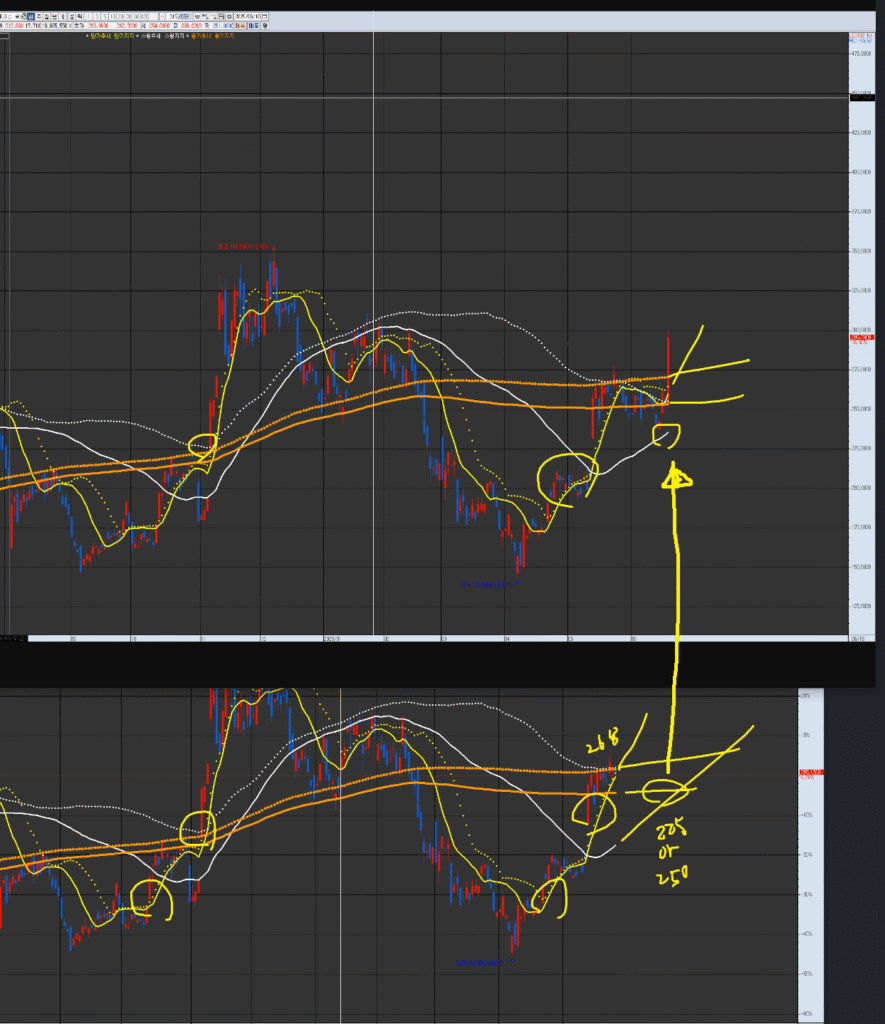
VPAR Chart Explanation This is Rocket Lab (RKLB), as requested for analysis. The circled areas in the past and present are potential short-term trend (yellow) consolidation and upward trend points. These points have a higher probability and potential return when they are near the swing line (white) or medium-term line (orange). Each chart has its own wave trend and tension. Currently, after finding support at the medium-term resistance/supply level in March-April, it is showing the flow of the medium-term trend (monthly wave) again and is being considered as a potential point for a short-term or swing trend. For specific entry points, please refer to the strategy scenario and report.
3️⃣ VPAR Rhythm Analysis
Monthly
Rhythm: Breakout from mid-box → large bullish wave ongoing
Social trends: Keywords like “Drone Executive Order,” “Defense sector gains,” “Backlog expansion,” “Aerospace growth” trending
✅ Summary
RKLB is currently in a bullish rhythm consolidation phase, supported by strong policy momentum and Defense sector tailwinds. Buy-the-dip strategy remains valid → watch for re-acceleration signals.
Hello, this is TopTrader Jinlog. You can check the details along with the chart on my blog. If you want continuous analysis, please subscribe or leave a comment. If you want to receive reports quickly, please choose the priority option.
2️⃣ Summary
✅ Is there still a short-term breakout potential in the current rhythm? Let’s analyze now.
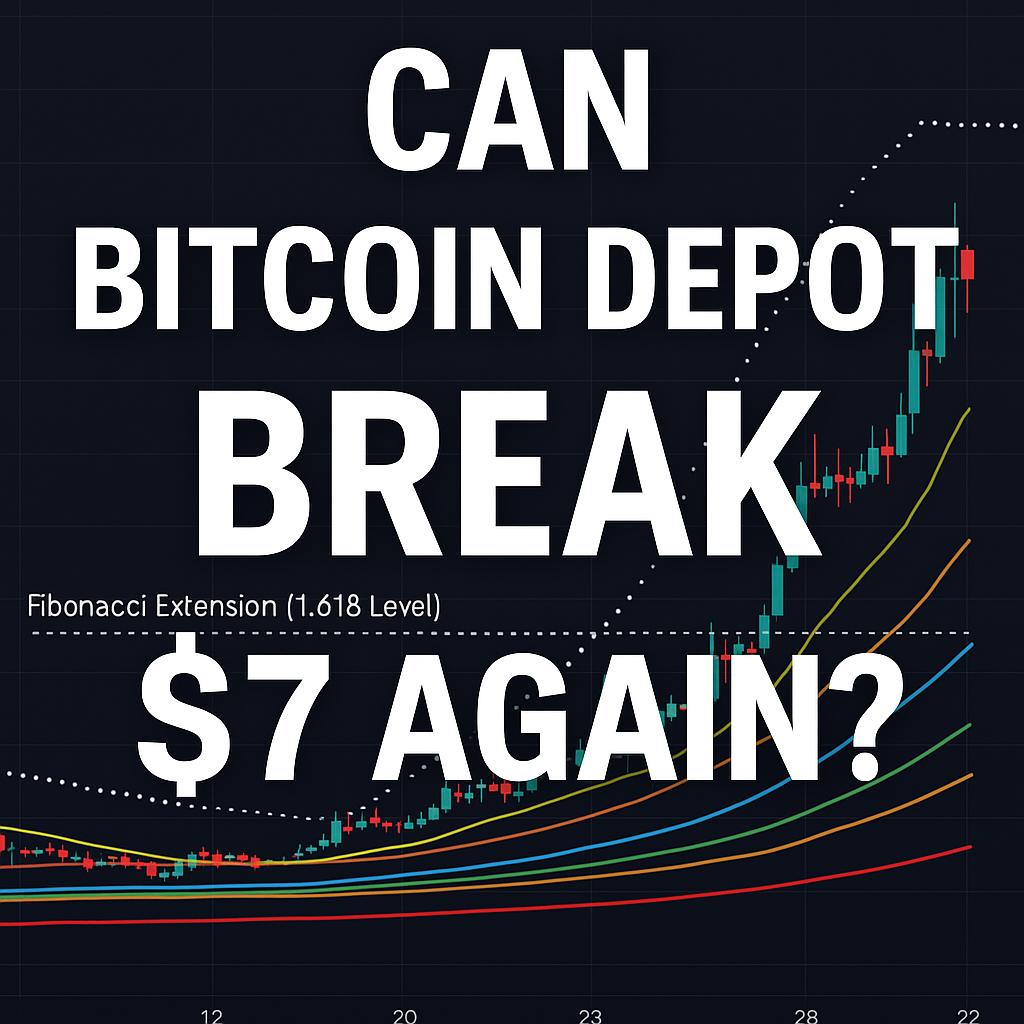
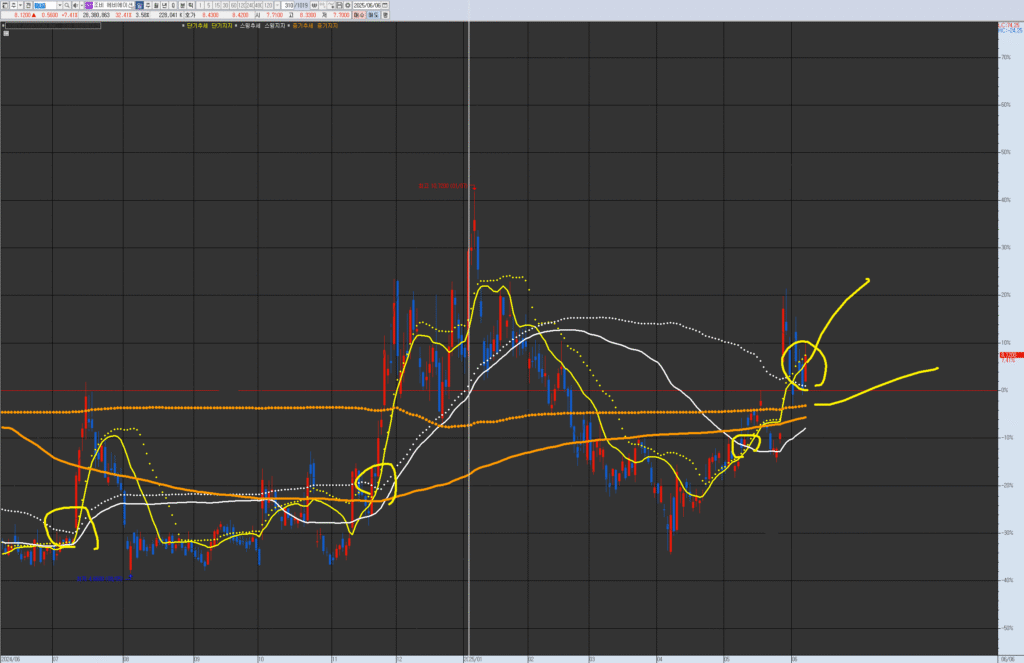
BTM recently surged +23% on new CFO appointment and earnings optimism, breaking its recent highs. Chart analysis:
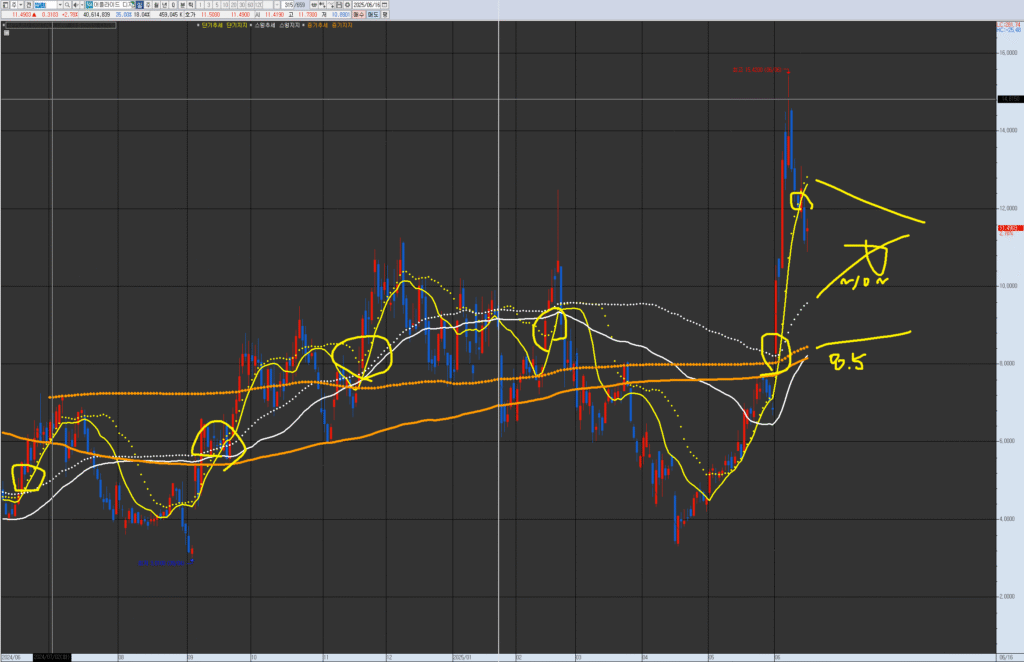
VPAR Chart Explanation This is Bitcoin Depot (BTM.NAS), as requested for analysis. The circled areas in the past and present are potential short-term trend (yellow) consolidation and upward trend points. These points have a higher probability and potential return when they are near the swing line (white) or medium-term line (orange). Each chart has its own wave trend and tension. Currently, after breaking through the medium-term resistance/supply in mid-May, it is continuing the short-term trend (daily wave) and is in a state of a 33% sharp upward move (“shooting”), although the minute chart shows divergence. If 6 dollars holds as support, there is a possibility of continuing the upward trend. Even if it breaks below (6 dollars), as long as Bitcoin’s swing trend is not broken, consider entering on dips to the short-term or swing line. For specific entry points, please refer to the strategy scenario and report.
3️⃣ VPAR Rhythm Analysis
Monthly
Rhythm: Large bullish breakout → mid-term bullish rhythm strengthening
Bands: Broke upper box → overbought signal
MACD: Strong bullish crossover
Weekly
Rhythm: Breakout above box top → consolidation likely
Bands: Above dotted top → testing center support
RSI: Overbought → potential short-term pullback
Daily
Rhythm: Multiple bullish candles → upper trap → possible consolidation
Bands: Above box top → monitoring for mean reversion
Volume: Decreasing after spike → watch for re-acceleration signals
Trap: Upper trap → recovery attempts to be monitored
4️⃣ Financials
TTM revenue: ~$699M → YoY +13.4%
Net loss: ~$14.6M → losses continuing
Aggressive expansion strategy in Bitcoin ATM market → leadership intact
Cash: $8.5M → sufficient for next 12 months
5️⃣ News & Risk Summary
News
New CFO appointed (ex-American Express) → increased confidence
Expanded strategic partnership with NCR → new growth potential
Institutional buying increasing → confirmed through recent flows
Risks
Overbought post-surge
Competitive pressure in ATM market
High BTC price correlation → volatility risk
6️⃣ Strategy Scenario
🎯 Entry
Buy in the $6.00 ~ $6.22 range
🎯 Targets
1st target: $6.60 (Probability 55%)
2nd target: $7.77 (Probability 65%)
3rd target (Long-term): $15.07 (Probability 75%)
🚫 Stop-Loss
Below $5.75 → trim half
Below $5.20 → full exit
7️⃣ Outlook
Currently entering a post-breakout consolidation phase. Mid-term bullish momentum remains valid, with BTC price and sector news likely to act as key triggers.
→ “Monitoring box support → buy-the-dip strategy is valid in this rhythm.”
8️⃣ Deep Report
Institutional flow: Net buying by institutions increasing
Short interest: ~2.6% → below average for crypto stocks
Social trends: Keywords like “New CFO,” “Bitcoin ATM growth,” “BTC rally-linked stocks” trending
✅ Summary
BTM remains in a high-volatility rhythm consolidation phase, with valid mid-term breakout potential aligned with BTC market movements. Buy-the-dip strategy → re-acceleration watch is valid.
Hello, this is TopTrader Jinlog. You can check the details along with the chart on my blog. If you want continuous analysis, please subscribe or leave a comment. If you want to receive reports quickly, please choose the priority option.
Summary
✅ Is there a chance for a short-term breakout in the current rhythm? Let’s analyze now.
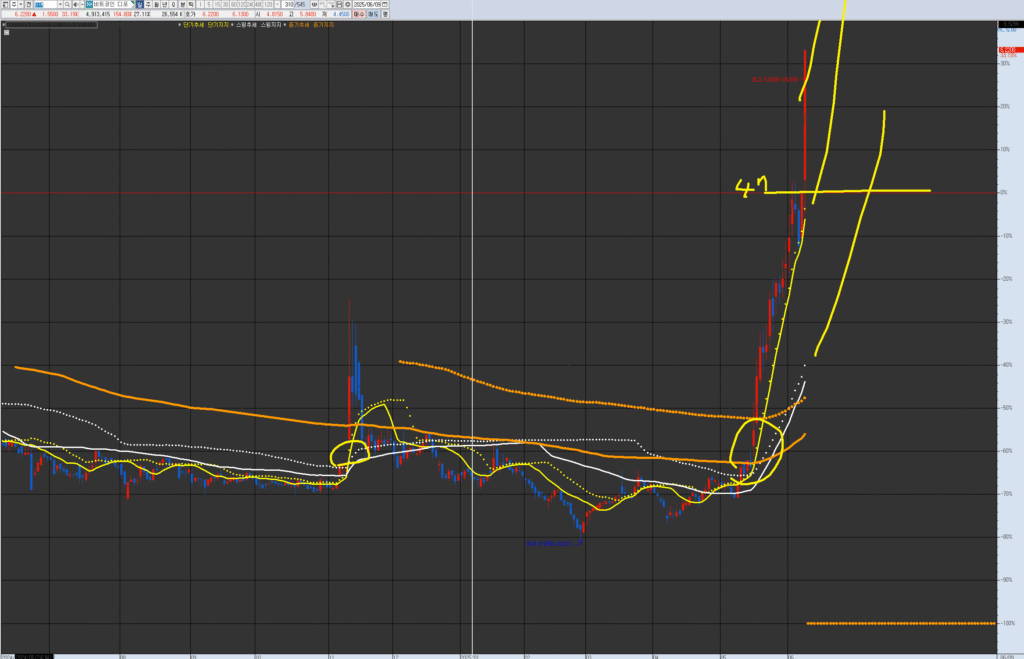
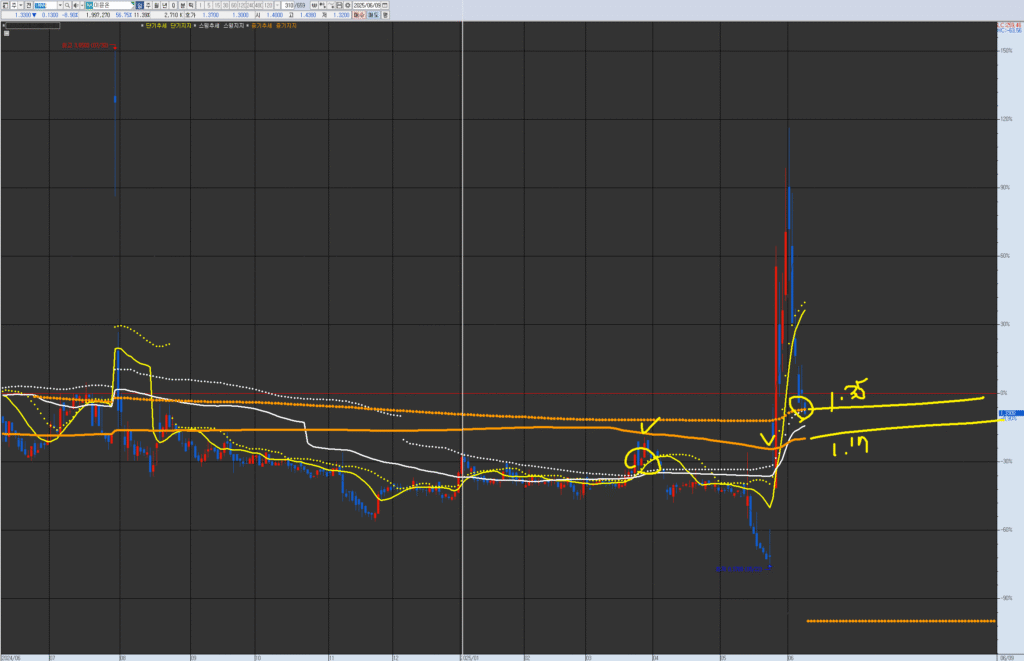
GRYP recently surged 442% in May following Bitcoin’s rally and the American Bitcoin merger news, and is now forming a box consolidation phase after the breakout.
Chart review:
60-min: Upper box trap → retracement → re-testing box top
Daily: Peak trap → consolidation near Bollinger middle band
VPAR Chart Explanation This is Gryphon Digital Mining (GRYP), as requested for analysis. The circled areas in the past and present are potential short-term trend (yellow) consolidation and upward trend points. These points have a higher probability and potential return when they are near the swing line (white) or medium-term line (orange). Each chart has its own wave trend and tension. Currently, after breaking through the medium-term resistance/supply, it is above the swing trend (weekly wave). While observing the process of absorbing short-term supply, consider it a point for potential swing entry. For specific entry points, please refer to the strategy scenario and report.
3️⃣ VPAR Rhythm Analysis
Monthly
Rhythm: Breakout from major low box → large bullish candle → potential correction
Bands: Exceeded upper dotted band → returning to box
Volume: Declining after spike → preparing for next move
Trap: Watching for recovery from recent trap
4️⃣ Financials
Q4 mining revenue: +4.2% → $3.85M
Net profit: $0.4M → turned positive
Debt reduction: $13M Anchorage debt converted to equity
Cash: $0.735M → liquidity risk remains
5️⃣ News & Risk Summary
News
American Bitcoin merger: Triggered 285% rally
Captus Energy acquisition: Building 4GW green mining infrastructure
Mining capacity expansion: +22% planned
Risks
Q1 EPS –0.089 → missed expectations
Insider selling (~$441K)
Ongoing net loss → FFO negative
6️⃣ Strategy Scenario
🎯 Entry
Buy in the $1.10 ~ $1.15 range
🎯 Targets
1st target: $1.35 (Probability 60%)
2nd target: $1.67 (Probability 65%)
3rd target (Long-term): $3.73 (Probability 70%)
🚫 Stop-Loss
Below $1.05 → trim half
Below $0.88 → full exit
7️⃣ Outlook
Currently in a high-volatility box with potential for re-acceleration. Since this stock is highly sensitive to Bitcoin price and news triggers, confirming support at the box center is essential before taking positions.
“The next breakout timing after this consolidation is key.”
GRYP remains in a high-volatility rhythm with valid breakout potential. Strong correlation with Bitcoin and merger news could trigger the next surge. Watch the box center level for optimal buy entry.
Hello, this is TopTrader Jinlog. You can check the details along with the chart on my blog. If you want continuous analysis, please subscribe or leave a comment. If you want to receive reports quickly, please choose the priority option.
.
Summary
✅ What breakout/ breakdown triggers should we watch for in this rhythm analysis? Let’s check below.
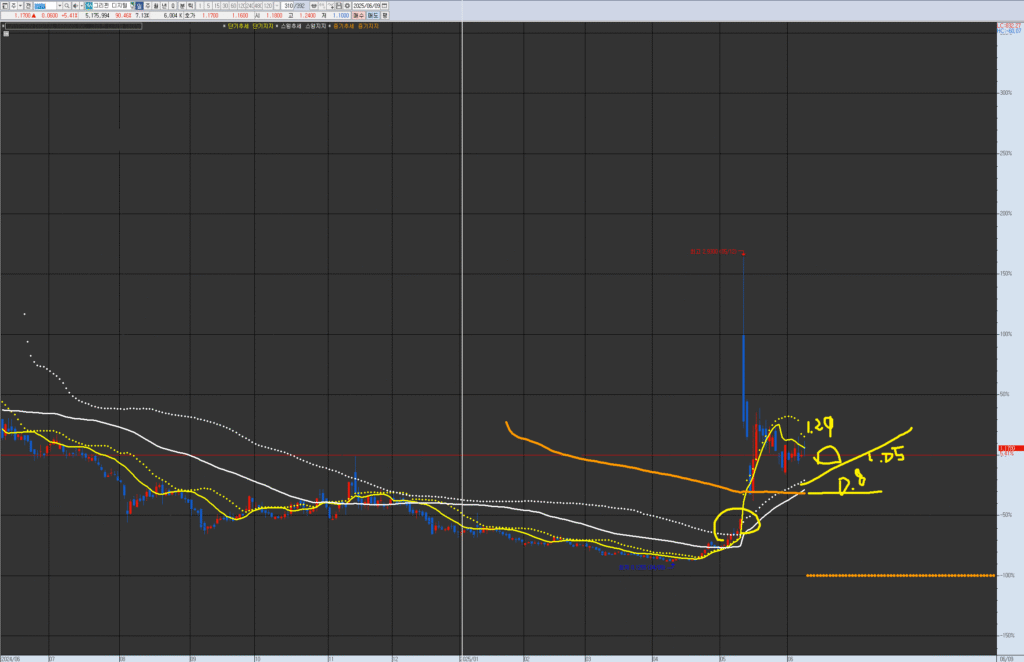
IMNN recently surged +95% in 3 trading days, driven by clinical trial and technology optimism, entering a high-volatility phase. Chart analysis:
Monthly: Breakout from low → overbought signals present
→ Classic post-breakout box consolidation phase, with mid-term bullish continuation potential depending on support.
1️⃣ Investment Opinion
📌 Short-term: Consolidating at upper box → watch for buy-the-dip opportunities 📌 Mid-term: Breakout continuation valid if trend restores 📌 Clinical news trigger could lead to another breakout
VPAR Chart Explanation This is ImmuneOn (IMNN), as requested for analysis. The circled areas in the past and present are potential short-term trend (yellow) consolidation and upward trend points. These points have a higher probability and potential return when they are near the swing line (white) or medium-term line (orange). Each chart has its own wave trend and tension. Currently, after breaking through the medium-term resistance/supply, it is in a state of reaching or being close to the swing and medium-term resistance/supply levels. However, there is a possibility that the tension may decrease, so consider re-entry after checking the support trend or event timing within approximately 2 weeks. For specific entry points, please refer to the strategy scenario and report.
3️⃣ VPAR Rhythm Analysis
Monthly
Rhythm: Breakout from low → large bullish candle → overbought
Bands: Exceeded upper dotted band → attempting pullback
Hello, this is TopTrader Jinlog. You can check the details along with the chart on my blog. If you want continuous analysis, please subscribe or leave a comment. If you want to receive reports quickly, please choose the priority option.
Investment Opinion
📌 Short-term: Wait and buy on dips → Focus on rhythm consolidation phase 📌 Mid-term: Upward trend potential remains valid 📌 Likely to repeat breakout phases driven by news/policy catalysts
✅ Where is the key rhythm zone this time? Check the points below.
Coupang recently entered a re-acceleration attempt phase after a 52-week high breakout and slight pullback. Technically, both monthly and weekly charts show a consolidation at the upper rhythm box, with an attempt to expand upward. Fundamentally, improving EBITDA margins, share buyback news, and OTT growth support the mid-term bullish momentum.
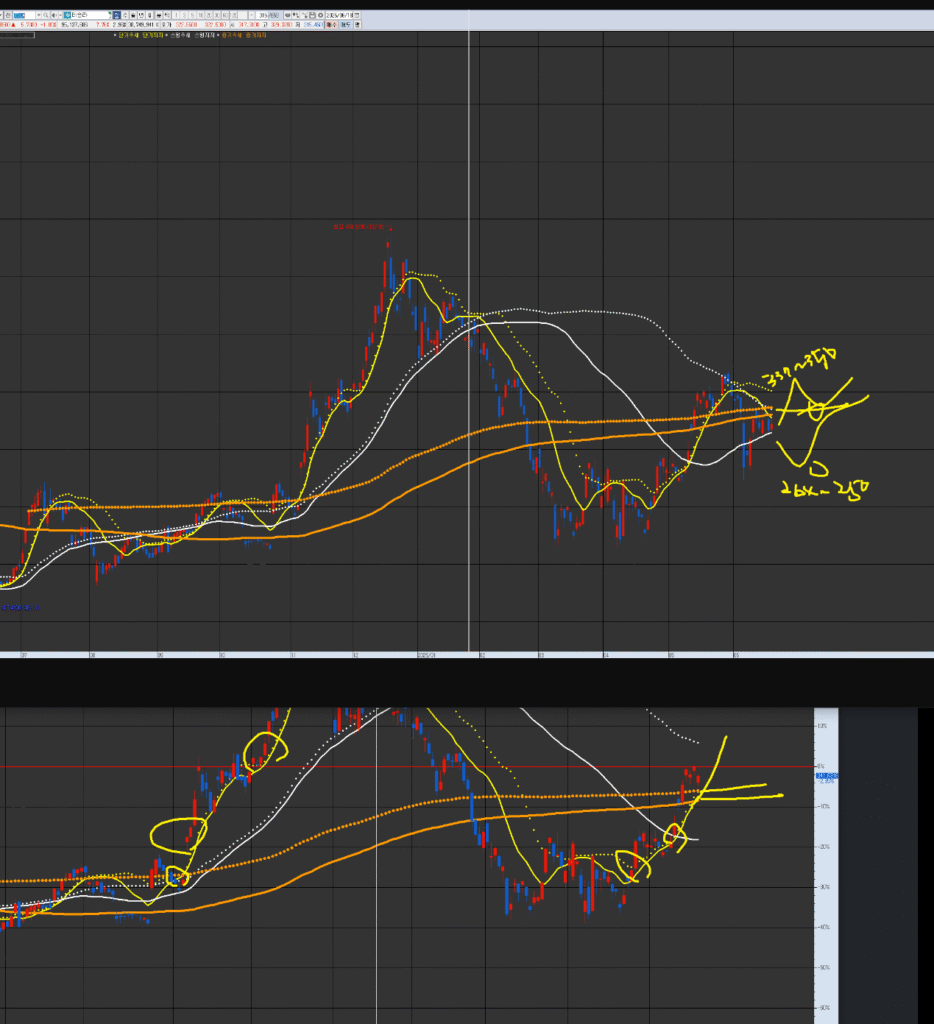
VPAR Chart Explanation This is the Coupang chart (CPNG), as requested for analysis. The circled areas in the past and present are potential short-term trend (yellow) consolidation and upward trend points. These points have a higher probability and potential return when they are near the swing line (white) or medium-term line (orange). Each chart has its own wave tension and trend. Currently, it has clearly transitioned to a long-term trend (yearly wave) since April 2024 and is showing an upward-sloping box pattern centered around the medium-term resistance/supply. When the short-term/swing deviation correction is complete, there is a possibility of a sharp upward move (“shooting”) if an event occurs. If it breaks below (the current support/box), consider it a point to enter the medium-term resistance/supply box.
3️⃣ VPAR Rhythm Analysis
Monthly
Rhythm: Testing upper box trap zone → Watching for re-acceleration
Bands: Approaching upper dotted band → Expansion potential remains valid
Bands: 20EMA / 60EMA in bullish alignment → Ready for further upside after pullback
Volume: Consistent inflow → Bullish signal
Daily
Rhythm: Rise → Consolidation → Early re-acceleration
Bands: Mid-box consolidation, upper test ongoing
MACD: Bullish crossover → Re-buy zone approaching
60-min
Rhythm: Failed breakout → Currently consolidating within short-term box
Volume: Decreasing → Momentum rebuilding needed
Trap: Upper trap formed, no full pullback → Re-entry valid
4️⃣ Financials
Revenue growth continues ($7.9B, +11%)
EBITDA margin improved to 4.8%
Net profit positive ($154M)
Strong liquidity ($6.0B cash)
5️⃣ News & Risk Summary
News
$15B credit secured → Enhances growth flexibility
$1B share buyback → Supports shareholder value
Coupang Play showing strong growth → Expanding OTT base
Risks
Insider selling reported → May cause short-term sentiment dip
Global expansion costs increasing
6️⃣ Strategy Scenario
🎯 Entry
Buy in the $27.80 ~ $28.20 range
🎯 Targets
1st target: $29.65 (Probability 60%)
2nd target: $32.00 (Probability 70%)
3rd target (Long-term): $43.50 (Probability 80%)
🚫 Stop-Loss
Below $26.90 → Trim half position
Below $25.50 → Full exit
7️⃣ Outlook
A new re-acceleration phase is unfolding after consolidation. The mid-term bullish momentum remains valid, supported by fundamental drivers. Watch the next 2–4 weeks for potential breakout above key resistance zones.
8️⃣ Deep Report
Institutional flow: Foreign net buying continues, institutional selling slowing
Short interest: Reduced to ~1.1%
Social trends: Positive keywords on “Coupang Play”, “share buyback”, “52-week high”
✅ Summary
Coupang remains in a mid-term bullish rhythm. Current phase offers a buy-the-dip opportunity, with potential for re-acceleration in coming weeks.
Hello, this is TopTrader Jinlog. You can check out this report with full charts on my blog. For continuous analysis, feel free to subscribe or leave a comment. If you want priority access to reports, please choose the priority processing option.
VPAR Chart Explanation This is Joby Aviation (JOBY.NYS), as requested for analysis. The circled areas in the past and present are potential short-term trend (yellow) consolidation and upward trend points. These points have a higher probability and potential return when they are near the swing line (white) or medium-term line (orange). Each chart has its own wave tension and trend. Currently, it is showing a trend of short-term/swing trend conversion above the medium-term (monthly wave) resistance/supply level. With the closing price above the short-term line, this stock is being considered for trading within a box range or entering for a swing trade, looking for a re-establishment on the short-term line or a return to a box pattern.
1️⃣ Investment Opinion
📌 Short-term wait & buy on dips → focus on rhythm convergence phase 📌 Medium-term upward trend potential remains valid 📌 Potential for repeated surge cycles driven by commercialization news/policy support
Joby Aviation is gaining traction with recent MOU in Saudi Arabia, additional Toyota investment, and supportive Trump executive order. Technically, monthly/weekly charts show rhythm convergence; daily/60min charts indicate an attempt to break out of short-term consolidation. Avoid chasing highs — rather, employ a buy-on-dips strategy within the current range.
3️⃣ VPAR Rhythm Analysis
🌕 Monthly
Resistance confirmed at ~$11 level → price returning to mid-range box.
Rhythm moving from convergence → incomplete acceleration → back to convergence.
Toyota $250M additional investment → strong support for manufacturing & certification.
Key technical milestone: successful test flight of two eVTOLs simultaneously.
⚠️ Risks
Potential delays in FAA certification process.
Uncertainty over exact commercialization timeline.
Potential for renewed overvaluation concerns.
6️⃣ Strategic Scenario
🎯 Entry
Initiate buys at ~$7.90 ~ $8.15 zone.
Consider adding on dips toward $7.507.70.
🎯 Targets
1st target: $8.90 (probability 68%)
2nd target: $9.50 (probability 63%)
Long-term target: $13.63 (probability 52%)
🚫 Stop-Loss
Cut position if closing below $7.20.
7️⃣ Outlook
“When technology surpasses imagination, the market often anticipates the change first.” Joby Aviation remains a visionary growth stock with both high potential and high risk. From a RHYTHMIX perspective, it is now in a phase of stepwise consolidation rather than immediate breakout. Policy momentum and industry tailwinds remain supportive — gradual medium-term accumulation is a valid approach.
8️⃣ Deep Dive
Institutional flows: net buying detected over past 2 weeks → institutional interest gradually increasing.
Short interest: 13.5% → relatively high → potential for squeeze remains.
Social trends: eVTOL mentions rising for 4 consecutive weeks → increasing public interest. Positive buzz particularly around Saudi-US-Japan (Toyota) collaboration.
Disclaimer
This report is based on VPAR rhythm analysis and is for informational purposes only. Investment decisions are at your own risk.
Updates will be provided if significant trend changes occur.
Hello, this is Top Trader Jinlog. You can conveniently review the full chart-based report on our blog. For continued market updates, feel free to subscribe or leave a comment.
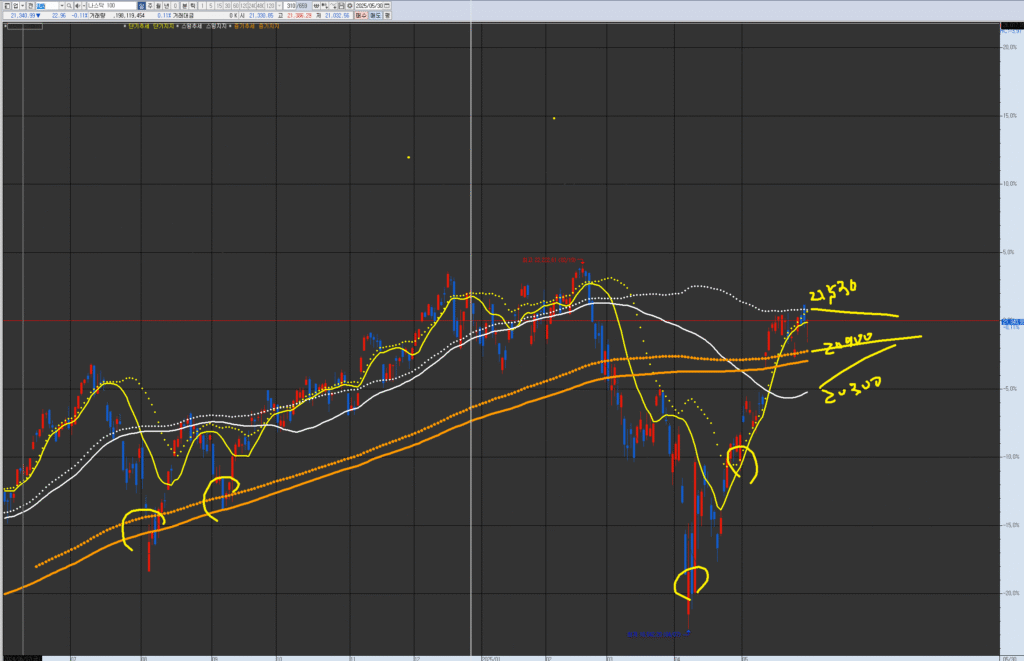
VPAR Chart Explanation This is the NASDAQ 100 chart. The circled areas in the past and present are potential short-term trend (yellow) consolidation and upward trend points. These points have a higher probability and potential return when they are near the swing line (white) or medium-term line (orange). Each chart has its own wave tension and trend. Currently, the key point of view is to check the re-ascending box pattern of the weekly wave (swing) between the short-term and medium-term resistance/supply levels.
Investment Outlook
NDX is currently positioned in a technical cooling phase with a time-based box consolidation, ahead of Q4’s anticipated policy event—the Genius Act. According to rhythm structure, the likely scenario is: confirm support within the box → buy on dip → pre-policy breakout attempt.
Mid-term (2 months): Breakout to $22,800+ possible as policy expectations strengthen (Probability: 65%)
Long-term (2 years): If digital payment systems expand and bond yield stabilizes, NDX may sustain a long-term uptrend (Probability: 70%) → Note: Monitor AI fatigue and political resistance risks
Summary
Market rallies rarely start suddenly. The current range-bound and slow-moving behavior reflects energy being stored. NDX is awaiting a pre-policy breakout, and as long as support holds, this could be a strategic buy-the-dip opportunity.
Key Variables
The Genius Act, aimed at digital payment and surveillance infrastructure, is likely to go to vote in Q4 (October–December).
The expansion of stablecoins (digitally pegged fiat assets) is increasing demand for U.S. Treasuries, pushing yields lower.
Lower yields support tech equity performance, reinforcing NDX momentum.
Within the tech sector, capital rotation toward AI and fintech remains visible.
Sector Snapshot (Key Rhythm Sectors Only)
Technology (XLK / QQQ) → Testing box top resistance. Direction will likely be defined with policy anticipation momentum.
Semiconductors (SMH / SOXX) → AI flow remains but overbought cooling underway. Pullback expected until CPI in June.
Software (IGV) → High-valuation names continue under pressure. Support around mid-band remains critical.
Cloud & AI Infrastructure (CLOU / WCLD) → Long-term expectations intact, but short-term fatigue is visible. Hovering near lower supports.
Consumer Tech (XLY / AMZN) → Consumer weakness + high interest rates = continued underperformance. Lowest priority within tech subsectors.
Chart Alignment
Monthly: Extended divergence with price nearing upper Bollinger band
Weekly: Volume decline and trend weakening observed
Daily: $21,500 resistance remains intact, while support at the rhythm midpoint is being tested
120-min: Box rhythm formation sustained near $21,080 midpoint
30-min: Downward wave patterns repeating
5-min: No clear direction—accumulation mode
Rhythm Trap
Daily Midpoint: $21,200 remains key to holding pattern
120-min Rhythm Line (mid-band): $21,080
Resistance at $21,500; support at $20,700
Current price remains within a clear box range between rhythm midpoints and upper bands
This setup is a textbook rhythm-based time correction pattern per RHYTHMIX Ver 7.0 standards
Stop-loss or Reversal: If price breaks below $20,600 (Probability 70%)
Outlook
With the Genius Act expected in 5–6 months, the market typically begins pricing in 3 months ahead. Hence, the next 1 month may be box-bound with limited breakout potential. Expect a clearer direction around August–September, as pre-policy optimism increases. Until then, risk control and box support validation remain essential.
Deep-Dive Report
Bond Yield Trends
10-year U.S. Treasury yield has pulled back to 4.33%, creating a supportive environment for tech.
Stablecoin-backed demand for bonds continues to weigh down yields.
Yield volatility will remain the key to short-term tech rotations.
Institutional Flow
ETFs in the tech sector continue to receive inflows.
AI, semiconductors, and fintech show relative strength during dips.
Key News
JP Morgan officially confirmed interest in issuing its own stablecoin.
Genius Act may pass Senate by Q4.
Political tension rising due to privacy surveillance concerns from opposition.
That concludes the NASDAQ100 (NDX) Market Report for May 31, 2025 – Ver 3.1. If you found this helpful, don’t forget to subscribe or leave a comment. The next critical trigger will likely be June CPI and shifts in interest rate tone.
Hello, this is Top Trader Jinlog. When the market converges on a zone, multiple technical signals align— and that one critical entry or resistance point can shift everything. RHYTHMIX is a rhythm-driven report that visually captures these key market moments so you can navigate with precision.
You can view charts and breakdowns on the blog. For more stock requests, feel free to comment or message anytime.
VPAR Chart Explanation This is Roblox (RBLX.NYS), as requested for analysis. The circled areas in the past and present are potential short-term trend (yellow) consolidation and upward trend points. These points have a higher probability and potential return when they are near the swing line (white) or medium-term line (orange). Each chart has its own wave tension and trend. Currently, it is in the process of transitioning to a medium-term (weekly wave) trend from the top of the weekly box, with the medium-term (monthly wave) trend still in place. The short-term trend is continuing, and if there is a break due to market influences, consider potential buying points at the weekly resistance around 75 and the monthly resistance around 65.
💡 Investment Opinion
Roblox (RBLX) posted a solid Q1 surprise and continues its momentum through a blend of platform growth and monetization expansion. Technically, the stock recently hit a 52-week high and is now in a short-term overbought zone, but trading volume and order flow remain strong—suggesting potential for further upside after this pause.
2-week target: +5.7% → $91.00 (Prob. 68%)
2-month target: +12.9% → $97.25 (Prob. 64%)
Long-term target: +34.1% → $115.40 (Prob. 59%)
🧠 Summary
Momentum brings peaks, and peaks bring rest. But this pause might be preparation for the next leg higher. Chart signals suggest the rhythm isn’t done yet.
📎 Key Takeaways
MACD has peaked but structure remains intact
Support holding near short-term center line
RSI cooling down post-peak → possible reacceleration
Breakout above $89.50 could trigger next wave toward $97+
→ Current rhythm structure: “overheat → compression → potential expansion” → Breakout above $89.50 would validate next impulse leg
📈 Rhythm Analysis (Technical Indicator Rhythm)
⏳ Monthly Rhythm
RSI still above 70 → extreme zone
MACD peaked, now stable
Long-term center line at $68.00 / resistance around $96.20
📉 Weekly Rhythm
MACD slowly reverting
$84.00 support reaffirmed
Slight divergence but not broken yet
⏱ Daily Rhythm
Boxed consolidation between $85.5–$86.5
MACD tapering off after expansion
Volume declining → calm before movement
🕐 120-min Rhythm
Short-term trend remains upward
RSI rebounding from mid-40s
✅ Pattern Match: 5 of 6 prior setups showed breakout → Avg +6.2% in 3–6 sessions
💰 Financial Highlights
Metric
Value
📌 Comment
Q1 FY25 Revenue
$1.035B (+29%)
Beat expectations, strong growth
EPS
-$0.32 (vs. -$0.40 est.)
Net loss narrowed, improved margins
Daily Active Users (DAU)
97.8M (+26%)
Growing user base
Engagement Hours
21.7B hours (+30%)
Strong user stickiness
Free Cash Flow
$427M (+123%)
Excellent cash generation and reinvestment potential
📰 News & Risk Summary
📌 FY25 bookings guidance raised to $5.28B–$5.36B
📌 Partnership with Google to integrate reward-based ads
📌 $282M paid to developers in Q1 alone
⚠️ RSI in overbought territory → risk of minor corrections
⚠️ Highly sensitive to gaming/metaverse industry sentiment
🎯 Strategy Scenario + Simulator
🔹 Entry Zone $84.50 ~ $86.50 → Strong support near short-term center line (Prob. 69%)
🎯 Target Zones
1st target: $91.00 (Prob. 68%)
2nd target: $97.25 (Prob. 64%)
Long-term: $115.40 (Prob. 59%)
🚫 Stop-Loss or Risk Strategy If price drops below $82.50, structure breaks → Exit immediately if accompanied by volume increase
📈 Pattern Simulator
7 out of 10 pattern matches hit target
Avg return: +7.4% within 5–6 trading days
Most reached target after MACD-wide restart
🌈 Outlook
Rhythm doesn’t vanish—it reorganizes. Roblox’s monetization and platform data speak for themselves, and the chart rhythm reflects it. What looks like stillness… might be preparation. Don’t mistake silence for weakness.