Alphabet C (GOOG) Breaks Mid‑Term Supply Zone: Buy at $182, $175 & $181?

Hello, this is JinLog, top trader.
I deliver rhythm analysis reports in a talk‐show format, and you can read the full report on my blog.
Reacting to every single news item leads to overtrading, which erodes both your capital and your time.
The VPAR Rhythm Trading Method captures the broader trend timing and only responds at key pivot zones.
By monitoring sector and stock together—and tuning into live broadcasts—you can manage risk and seek higher returns efficiently.


Summary
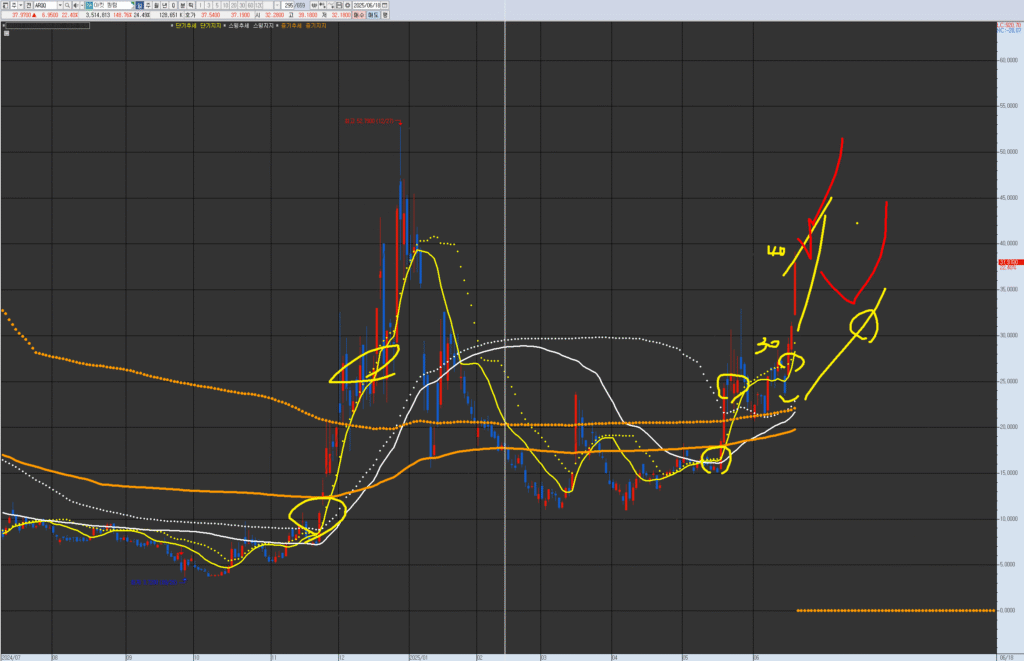
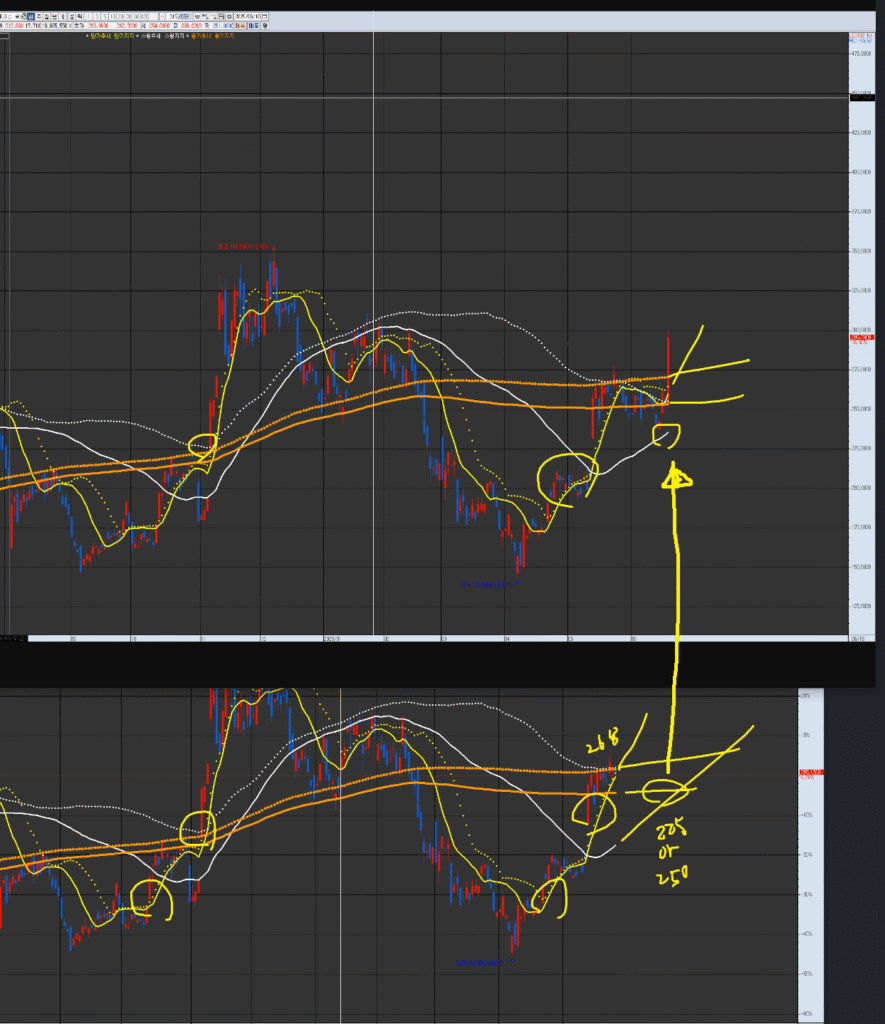
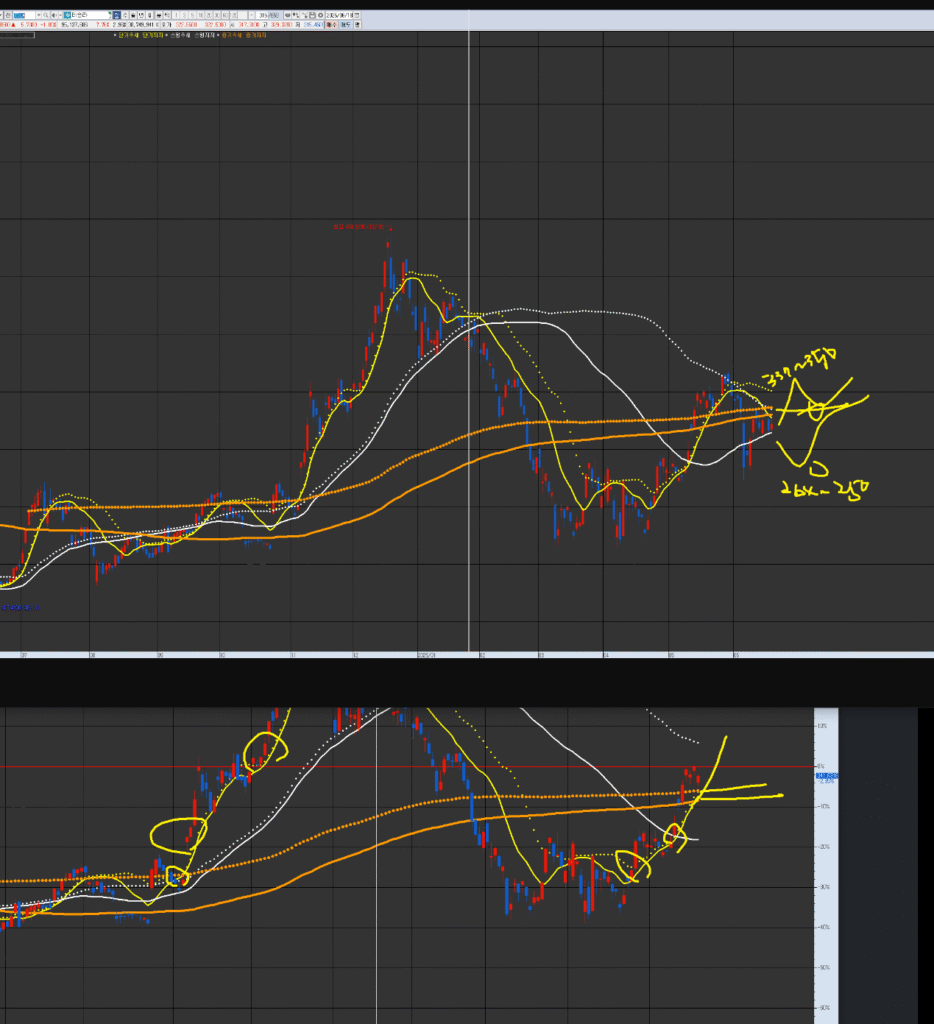
Alphabet C entered a swing trend in early July and has just cleared a mid‑term supply zone, signaling a potential shift from range waves into a sustained uptrend.
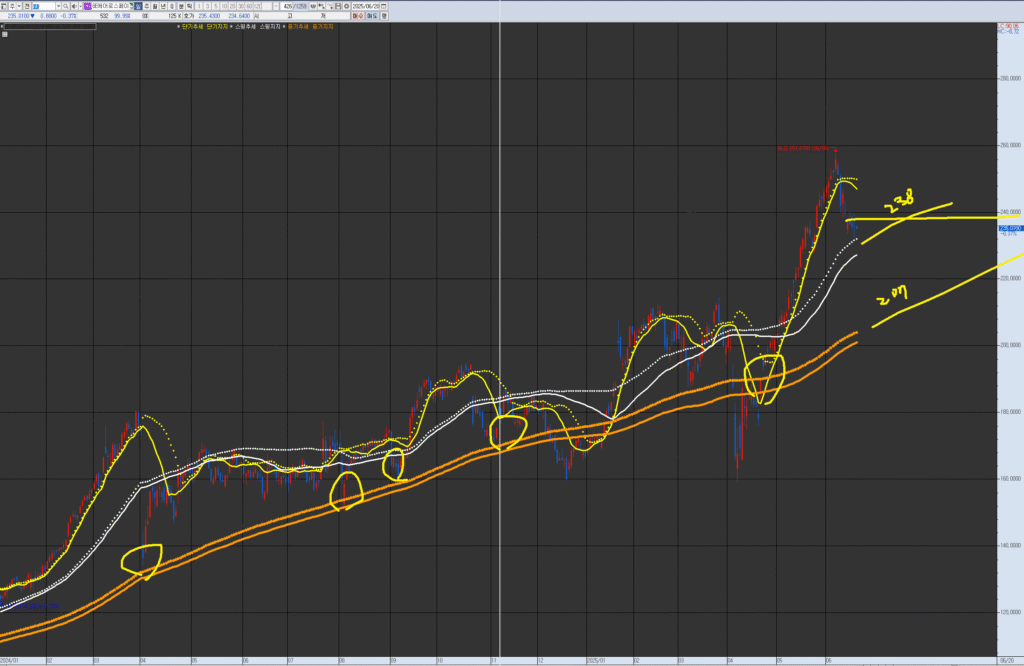
It currently trades at $185.94, with entry points at $182 (short), $175 (swing) and $181 (mid). Targets are set at $195, $217 and $240 respectively. Google Cloud’s 26% revenue growth and the OpenAI partnership underpin AI demand, but EU antitrust fines and Chrome divestiture talks present regulatory headwinds.


Investment Opinion

  • Short‑Term Buy
    Entry: $182 → Target: $195
    Enter when rhythm formation and TRAP ≥2/3 are confirmed.
  • Swing‑Term Buy
    Entry: $175 → Target: $217
    Enter on a rhythm pullback & recovery alongside sustained order‑flow buildup.
  • Mid‑Term Buy
    Entry: $181 → Target: $240
    Enter after mid‑term consolidation signals a new acceleration and regulatory risks are priced in.

Chart Explanation
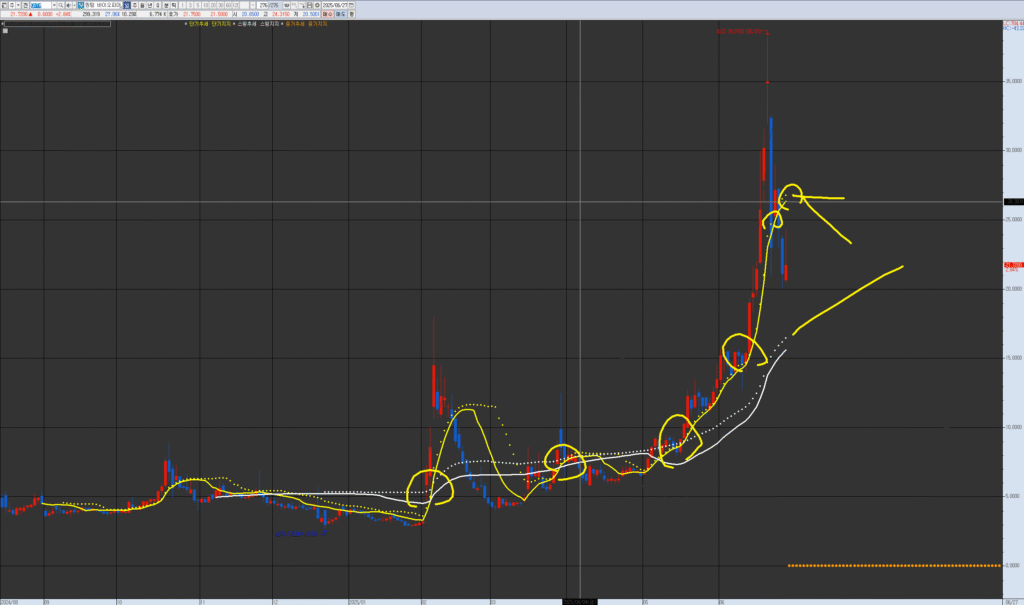
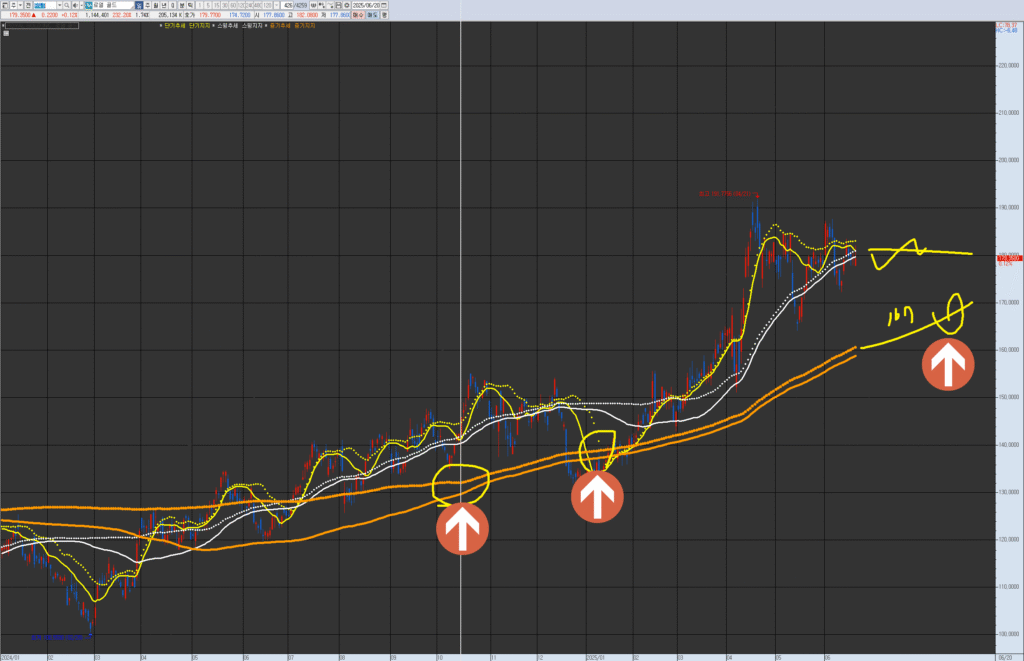
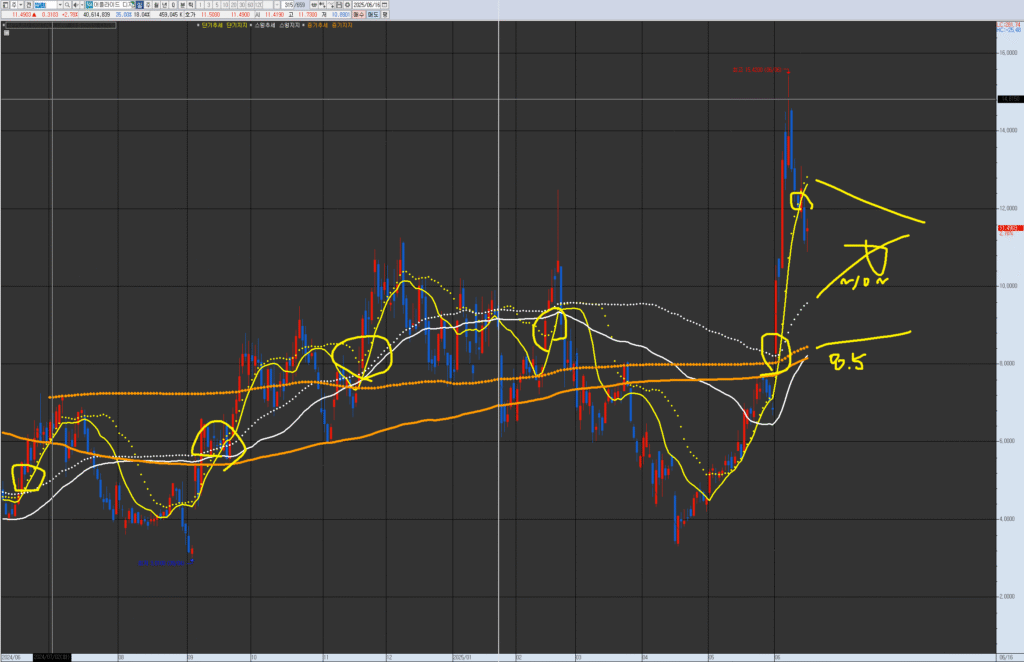
Here is the Alphabet C (GOOG) chart you requested.
The circled zones mark short‑term consolidation and breakout points.
Touches of the swing and mid pivots tend to offer higher-probability, higher-reward entry opportunities.
Always verify trend and wave flow across multiple timeframes.


Rhythm Analysis

  • Short‑Term Rhythm: Acceleration/maintenance — band expansion confirms rising momentum.
  • Swing‑Term Rhythm: Upswing/maintenance — centerline recovery signals a solid trend.
  • Mid‑Term Rhythm: Formation — band contraction suggests a buildup before the next leg.

Financial Flow

  • Q2 2025 Results: Revenue $93.8 B (+10.7% YoY), Net Income $26.5 B (+12.2% YoY).
  • Google Cloud: Revenue $12.26 B (+26% YoY), anchoring growth.
  • Balance Sheet: Strong cash reserves and ample R&D capacity.

News / Risks / Events

  • OpenAI Partnership: OpenAI designates Google Cloud as its official cloud partner, fueling AI workloads.
  • Regulatory Risk: EU antitrust fine of €4.1 B and ongoing Chrome divestiture discussion.
  • Analyst Views: Consensus “Strong Buy,” KeyBanc raises target to $215.

Strategy Scenarios

  • Short‑Term
    • Entry: $182
    • Conditions: TRAP ≥2/3 + rhythm formation + order‐flow buildup + OpenAI event check
  • Swing‑Term
    • Entry: $175
    • Conditions: TRAP ≥2/3 + rhythm recovery + order‐flow buildup + volatility check
  • Mid‑Term
    • Entry: $181
    • Conditions: TRAP ≥2/3 + mid‐term formation + regulatory risk monitoring + order‐flow buildup

Elliott Wave Analysis

  • Short‑Term: Wave 3 at $182 with TRAP 2/3 and rhythm expansion—prime impulse wave.
  • Swing‑Term: Wave 4 at $175 with TRAP 2/3 and rhythm recovery—ideal re‑entry.
  • Mid‑Term: Wave 2 at $181 with TRAP 2/3 and order‑flow buildup—foundation for next impulse.

Community Flow

  • Reddit r/technology: Mentions +15% (3,800 → 4,370), top keywords “Google Cloud”, “AI”, “Antitrust”
  • Twitter (#GOOG): Tweets +20% (2,200 → 2,640), sentiment 60% positive / 25% negative / 15% neutral
  • StockTwits: Mentions +12% (1,500 → 1,680), bullish bets 68% / bearish 32%

Sentiment Indicators:
Top positive: “growth”, “partnership”, “cloud”
Top negative: “regulation”, “fine”, “sell‑off”


Outlook & Risk Summary
The OpenAI alliance and Q2 results are poised to drive momentum.
However, the EU antitrust fine and Chrome sale debate heighten uncertainty, so event‑driven risk management is essential.


In‑Depth Report
Institutional net purchases are up 12% year‑to‑date.
AI‑driven screening shows GOOG’s S&P 500 weight at 4%, among the sector leaders.
Overseas funds account for 24% of ownership, confirming robust global inflows.
These order‑flow dynamics, paired with rhythm analysis, refine optimal entry points.


Brand Notice
This report is produced using the VPAR rhythm analysis method, combining chart rhythm flows and order‑flow patterns to suggest optimal trading points. All investment decisions are the sole responsibility of the investor.

IONQ (IONQ): $1 B Funding Secured… What’s the Next Buy Price?

  1. Hello, this is JinLog, top trader.
    I provide rhythm analysis reports in a talk‐show style, and you can find the full report on my blog.
    Reacting to every piece of news or event often leads to overtrading, which erodes both your capital and your time.
    The VPAR Rhythm Trading Method captures the broader flow timing and selectively responds only at key ‘pivot’ zones.
    By monitoring both sector and individual stocks—and tuning in to live broadcasts—you can manage risk and seek higher returns efficiently.
  2. Summary
    IONQ remains in its swing trend without any breakdown, displaying clean algorithmic pattern waves around the current price of $46.51.
    On July 7, the company closed a $1 billion funding round, boosting cash reserves to roughly $1.68 billion ahead of its Q2 earnings on August 6.
    Entry points are set at $44.50 (short), $41.00 (swing), and $33.50 (mid), with target prices of $58 (short) and $59 (swing); the mid‐term target is currently unmeasured by our rhythm model.
    Will the algorithmic wave structure, combined with rhythm and order‐flow signals, deliver the optimal entry?
  3. Investment Opinion
  • Short‑Term: Buy at $44.50, target $58 — enter when rhythm formation and order‐flow buildup confirm support.
  • Swing‑Term: Buy at $41.00, target $59 — consider entry after a rhythm pullback and sustained order‐flow buildup within the accelerated trend.
  • Mid‑Term: Buy at $33.50 — assess once rhythm pullback transitions to expansion and broader macro context aligns.
  1. Chart Explanation [Fixed Phrase:]
    Here is the IONQ chart you requested.
    The circled areas mark short‑term trend consolidation and breakout points.
    The closer price touches the swing or mid pivot zones, the higher the probability and potential reward.
    Always verify trend and wave flow on each timeframe.
  2. Rhythm Analysis
  • Short‑Term Rhythm: Formation phase — Bollinger Band narrowing indicates a pending directional decision.
  • Swing‑Term Rhythm: Weakening/Adjustment phase — brief band expansion followed by stabilization.
  • Mid‑Term Rhythm: Expansion phase — increasing volatility signals broader trend continuation.
    Use RSI and MACD alongside to strengthen signal reliability.
  1. Financial Flow
    Q1 revenue was $7.6 M with a $32.3 M net loss, reflecting heavy R&D investment.
    The July 7 funding boost increased pro‑forma cash to $1.68 B, enhancing financial stability.
    Q2 results will be released after market close on August 6.
  2. News / Risks / Events
  • Acquired Capella Space to advance a satellite‑based QKD network.
  • Competes with D‑Wave and Rigetti; IonQ’s integrated hardware/software/network approach is viewed as a competitive edge.
  • Analysts rate “Strong Buy” on average, but the 12‑month consensus target of $41.43 implies downside risk.
  • Key upcoming event: August 6 Q2 earnings release and funding utilization update.
  1. Strategy Scenarios
    Short‑Term Buy
  • Entry: $44.50
  • Conditions: TRAP cleared ≥2/3 + rhythm formation + order‐flow buildup + Q2 earnings check

Swing‑Term Buy

  • Entry: $41.00
  • Conditions: TRAP cleared ≥2/3 + rhythm pullback then recovery + order‐flow buildup + market‐type check

Mid‑Term Buy

  • Entry: $33.50
  • Conditions: TRAP cleared ≥2/3 + rhythm pullback then expansion + sustained order‐flow + macro alignment
  1. Elliott Wave Analysis
  • Short‑Term: Wave 3 entry at $44.50 coincides with TRAP 2/3 and rhythm expansion—prime impulse wave setup.
  • Swing‑Term: Wave 4 correction at $41.00 with TRAP 2/3 and rhythm recovery—ideal re‑entry point.
  • Mid‑Term: Wave 2 retracement at $33.50 with TRAP 2/3 and order‐flow expansion—foundation for the next impulse.
  1. Community Flow
    Reddit r/quantumcomputing
    – Mentions ↑22% month‑on‑month (4,200 → 5,124)
    – Top keywords: “QKD”, “Capella”, “IonQ”

Twitter (#IonQ)
– Tweets ↑60% (1,100 → 1,760)
– Sentiment: +65% positive / 20% negative / 15% neutral
– Key influencers: @QuantumDaily, @IonQ_Corp

StockTwits
– Mentions ↑10% (3,000 → 3,300)
– Bullish bets: 70% / Bearish: 30%

Sentiment Indicators:
– Top positive keywords: “funding”, “expansion”, “network”
– Top negative keywords: “losses”, “dilution”, “risk”

  1. Outlook & Risk Summary
    The funding infusion and Q2 results will be major catalysts for price action.
    Short interest is ~13.5% and institutional net buying is 8%, limiting downside risk.
    However, competitive pressures and a lowered analyst target warrant caution.
  2. In‑Depth Report
    Institutional investors have increased net purchases by 15% year‑to‑date.
    AI‑driven screening shows IonQ’s index inclusion weight at 12%, among the highest in the sector.
    Overseas fund allocation stands at 9%, confirming global capital inflow.
    These order‑flow dynamics, combined with rhythm analysis, refine optimal entry points.
  3. Brand Notice [Fixed Phrase:]
    This report is produced using the VPAR rhythm analysis method, combining chart rhythm flows and order‐flow patterns to suggest optimal trading points. All investment decisions are the sole responsibility of the investor.

DataDog (DDOG): Consolidation Around $140 Before Renewed Rally? What’s the Next Upside Target?

DataDog #DDOG #CloudSecurity #AI #SP500 #TechStock #ITInfrastructure #RhythmAnalysis #Trading #PriceForecast #BuySignal

  1. Hello, this is TopTrader JinLog.
    You can find the full analysis report on my blog.
    This video provides a talk-show style commentary followed by a rhythm analysis report.
    Please check the full report on my blog.
  2. Summary
    DataDog is consolidating around the $140 level in both short-term and swing timeframes, suggesting the potential for a medium-term trend shift once this base holds. The recent inclusion in the S&P 500 triggered a 15% price surge. Q1 revenue grew 25% year-over-year, and Q2 guidance implies 22–23% growth, underscoring strong AI-driven cloud security demand. Key entry points are $140 (short), $129 (swing), and $123 (medium), with target ranges of $152–165 and $169–184. Medium-term targeting awaits fresh rhythm confirmation.
  3. Investment Opinion
  • Short-term Target: $152–165 zone; recommend buying on confirmation of support near $140.
  • Swing-term Target: Upon clearing $129, look for upside to $169–184, managing volatility carefully.
  • Medium-term View: Monitor support at $123; rhythm not yet fully measured, so proceed cautiously.
  1. Chart Description
    “Here is the chart of DataDog (DDOG.NAS) you requested.
    The circled areas mark short-term consolidation followed by uptrend continuation.
    Higher-probability entry zones coincide with swing and medium-term trend lines.
    Always verify trend and wave structure on each chart before taking action.”
  2. Rhythm Analysis
  • Short-term Rhythm: In the expansion/formation phase, showing band-width contraction—an initial compression stage.
  • Swing-term Rhythm: Also in expansion/formation, attempting to recover toward the band center.
  • Medium-term Rhythm: Entering weakening/adjustment (divergence) phase, with a shift from expansion back toward contraction.
    Recommendation: monitor RSI and MACD histogram shifts alongside these phases.
  1. Financial Flow
  • Q1 2025 Revenue: $761.6 M, +25% YoY
  • Operating Cash Flow: $272 M; Free Cash Flow: $244 M
  • EPS: $0.46 vs. $0.43 consensus
  • Q2 2025 Guidance: $787–791 M revenue (+22–23% YoY), non-GAAP operating income $148–152 M (≈19% margin)
  • Full-Year Outlook: Raised to $3.22–3.24 B from prior $3.18–3.20 B, driven by robust AI security demand.
  1. News / Risks / Events
  • S&P 500 Inclusion (Early July): Drove a 15% price jump on expectations of increased liquidity.
  • AI-Driven Cloud Security Demand: Positive Reuters coverage highlights strength in this segment.
  • Analyst Upgrades: Bank of America and others raised target prices, boosting sentiment.
  • Risks: Technology sector volatility, macroeconomic headwinds, and the potential for rising short interest.
  1. Strategy Scenarios
  • Short-term Buy Strategy
    • Entry Zone: Around $140 consolidation area
    • Conditions: Trap relief ≥2/3 steps + expansion/formation rhythm + volume surge + S&P 500 inclusion tailwind
  • Swing-term Buy Strategy
    • Entry Zone: Around $129
    • Conditions: Trap relief ≥2/3 + expansion/formation rhythm + confirmation of market regime (high vs. low volatility)
  • Medium-term Buy Strategy
    • Entry Zone: Around $123
    • Conditions: Trap relief ≥2/3 + shift from weakening to adjustment in rhythm + consideration of longer-term macro context
  1. Elliott Wave Analysis
  • Short-term: Wave 3 progression, entry at $140, with Trap 2/3 + expansion/formation rhythm.
  • Swing-term: Wave 4 correction, entry at $129, with Trap 2/3 + expansion/formation rhythm.
  • Medium-term: Wave 1 re-initiation, entry at $123, with Trap 2/3 + weakening/adjustment rhythm.
  1. Community Flow
  • Reddit r/DevOps: Mentions +15% MoM (3,200 → 3,680), top terms “DataDog_AGENT,” “monitoring,” “alert.”
  • Twitter (#DataDog): Tweets up 25% (1,200 → 1,500), sentiment: Positive 68% / Negative 17% / Neutral 15%; key influencers @DataDogHQ, @OpsTechX.
  • StackOverflow: Questions up 27% (150 → 190), top tags “dd-trace,” “datadog-api.”
  • Sentiment Keywords: Positive: “performance,” “visibility,” “security”; Negative: “latency,” “cost,” “overhead.”
  1. Outlook and Risk Summary
    If $140 support holds, further short-term gains are likely, but tech-sector volatility warrants risk controls. Medium-term outlook remains constructive given AI security tailwinds, though global macro uncertainty and rising short interest pose potential headwinds.
  2. Deep Dive Report
  • Institutional Flows: Net inflow of 1.2 M shares over the past 4 weeks, reinforcing the uptrend.
  • AI Business Impact: AI security accounted for 35% of revenue, serving as a key growth driver.
  • Order-Book Pressure: MACD histogram turned positive; RSI approaching overbought territory—monitor for momentum shifts.
  1. Brand Disclaimer
    This report is produced using the VPAR rhythm analysis methodology, combining chart rhythm flows with order-book patterns to identify optimal trading points. All investment decisions are at the investor’s own risk.

D-Wave Quantum (QBTS.NYS) Price Outlook?

DWaveQuantum #QBTS #QuantumComputing #PriceOutlook #MarketAnalysis #FinancialAnalysis #NewsUpdates #RhythmAnalysis #VPARAnalysis #MACDAnalysis #TechnicalAnalysis #ShortTermTrading #SwingTrading #MidTermInvestment

Hello, this is TopTrader JinLog.
In this video, after a talk-show style discussion, we present the RHYTHMIX Ver 17.1 rhythm analysis report for D-Wave Quantum.
You can find the full written report on my blog.
Be sure to subscribe so you can catch real-time index flows at key rhythm points during my live posts and streams.

4. Summary
D-Wave Quantum (QBTS.NYS) has risen approximately 90% year-to-date, demonstrating strong positive momentum. The current share price is around $16.68. In Q1 2025, revenue reached $15 million (up 500% YoY) and operating income turned positive at $13.9 million. The company completed a $400 million ATM equity raise on July 1, bringing total available cash to over $550 million. Analysts’ price targets range from an average of $15.14 to as high as $20, driven by Advantage2 commercialization and expanding global partnerships. We recommend focusing on entry zones at 15.4 (short term), 15.7 (swing) and 9.87 (mid term), aligned with rhythm and flow shifts.

5. Investment Opinion

  • Short-Term Target: $19.70 → ~18% upside from current levels
  • Swing Target: $24.00 → testing next resistance zone
  • Mid-Term Target: Not specified — to be reassessed after upcoming earnings and macro developments

6. Chart Explanation
“The chart for D-Wave Quantum (QBTS.NYS) shows highlighted circles at zones where short-term trend convergence meets an up-trend breakout. Entry probabilities and potential returns tend to be higher near swing and mid-term bands. Always verify trend and wave progression on each chart before executing.”

7. Rhythm Analysis
Currently in a weakening/adjustment phase (expansion flow) as Bollinger bands widen. Watch for oversold conditions and confirm a band-center (mean-reversion) attempt alongside RSI and MACD signals before committing.

8. Financial Overview

  • Q1 2025 Revenue: $15 million (YoY +500%)
  • Q1 2025 Operating Income: $13.9 million (turned positive)
  • Cash Position: Raised $400 million via ATM on July 1; total cash > $550 million
  • EPS Consensus: –$0.06 for Q2 2025, indicating narrowing losses
  • Next Earnings: Scheduled between August 6–11, 2025

9. News / Risks / Events

  • Staque Partnership: Accelerates quantum application adoption in Middle East
  • Yonsei University Alliance: Joint research and commercialization efforts in South Korea
  • Carahsoft Distribution: Expanded U.S. public-sector procurement channel
  • Advantage3 Roadmap: Targeting 2028 launch for next-gen system
  • Risks: Potential delays in enterprise adoption and global economic slowdown

10. Strategy Scenarios

  • Short-Term Buy
    • Entry Zone: ~15.4
    • Conditions: TRAP resolved at 3/3 + rhythm/flow reversal + impact of ATM raise
  • Swing Buy
    • Entry Zone: ~15.7
    • Conditions: TRAP ≥2/3 + rhythm/flow reversal + high-volatility environment confirmation
  • Mid-Term Buy
    • Entry Zone: ~9.87
    • Conditions: TRAP ≥2/3 + rhythm/flow reversal + consideration of longer-term macro context

11. Elliott Wave Analysis

  • Short-Term (Wave 3): Entered expansion in wave 3 after TRAP resolution
  • Swing (Wave 4): Expecting corrective wave 4 near swing resistance
  • Mid-Term (Wave 1): Observing initial wave 1 formation on longer timeframe

12. Community Flow

  • Reddit r/QuantumComputing
    • Mentions +28% MoM (4,600 → 5,900)
    • Top keywords: “Advantage2,” “scaling,” “public sector”
  • Twitter #DWaveQuantum
    • Tweets 1,200 → 1,850 (+54%)
    • Sentiment: 62% positive / 18% negative / 20% neutral
  • StockTwits
    • Mentions 3,200 → 3,800 (+19%)
    • Bullish bets 74% / Bearish 26%
  • Sentiment Indicators
    • Top positive keywords: “breakthrough,” “expansion,” “partnership”
    • Top negative keywords: “losses,” “dilution,” “competition”
    • Highlight any influencer with ≥5 mentions in this section

13. Outlook & Risk Summary
Institutional buying remains strong while short interest sits below 3%. Key risks include delayed enterprise uptake and a possible macroeconomic slowdown. Close monitoring of earnings results and partnership progress is essential.

14. Deep Dive Report
An upcoming deep dive will quantitatively detail institutional orders, AI adoption metrics (e.g., Staque deployments), and further analysis of Vontobel’s increased holdings to inform advanced entry/exit guidance.

15. Brand Disclaimer
This report is based on the VPAR rhythm analysis methodology, combining chart rhythm flows with order-flow patterns to propose optimal trading points. All investment decisions are your responsibility.

Quantum BioPharma: Trap Formed Amid Rhythm Contraction — Is the Swing Reversal in Sight?

#QuantumBioPharma #QNTM #BiotechStocks #NASDAQ #ClinicalPipeline #SwingTrading #PriceTrap #ElliottWave #StockForecast #VolatileStock #RhythmAnalysis #TechnicalStrategy #InstitutionalFlow #FDAApproval #BiotechMomentum

Hello, this is JinLog, your top trader and market analyst.
This video includes both technical analysis and strategy breakdowns.
You can also find a blog-format summary of this report for quick reference.


4. Summary


Quantum BioPharma is currently in a rhythm contraction with a price trap in place, showing strategic opportunities at swing and mid-term price zones.

  • Short-term trend: Breakdown → Trap at 0/3 phase
  • Swing trend: Maintained with rhythm contraction → Entry range: 17 ~ 18.82
  • Mid-term trend: Sustained → Rhythm expansion → Strategic entry at 15

📌 Note: The short-term price target of 25 was reached on June 17. Further movement depends on rhythm recovery.


5. Investment Outlook

  • Short-term: Trap phase active; reentry only after rhythm recovery
  • Swing: Trend intact; monitor for rhythm and flow reversal
  • Mid-term: Expansion trend with potential for a strong move

6. Chart Explanation

📌 (Standard Commentary)
“This is the chart of Quantum BioPharma.
Past and current circled areas show trend merges and bullish structures.
Entries near the swing or mid-term lines are historically higher probability zones.
Be sure to track rhythm and wave flow on each chart.”


7. Rhythm Analysis

  • Short-term Rhythm: Contracting with 0/3 trap structure; direction undecided
  • Swing Rhythm: Contracting but trend intact; watch entry at 17 ~ 18.82
  • Mid-term Rhythm: Expanding; signals breakout potential if continuation occurs

8. Financial Overview

  • Zero revenue; trailing net loss of ~$20.88M
  • Debt ratio around 28% → financially stable
  • Cash burn (Q1): Op CF –$1.48M / Levered FCF –$5.12M
  • Subsidiary Unbuzzd actively raising capital for pipeline advancement

9. News / Risk / Events

  • June: Private placement led by insiders (MVS shares)
  • Subsidiary Unbuzzd launching Reg D funding pre-IPO
  • Clinical progress on Lucid-MS and FSD202
  • $700M class-action lawsuit over alleged market manipulation
  • Crypto assets (~$4.5M) held for staking & yield generation

10. Strategy Scenarios

Short-term Buy Strategy

  • Entry Zone: (if recovered) 20.5 ~ 22.2
  • Condition: Trap phase cleared (2/3) + rhythm recovery + supply flow reversal

Swing Buy Strategy

  • Entry Zone: 17 ~ 18.82
  • Condition: Trap 2/3 resolved + rhythm & demand flow shift

Mid-term Buy Strategy

  • Entry Zone: 15
  • Condition: Confirmed rhythm expansion + strong accumulation flow

11. Elliott Wave Analysis

  • Current Position: Wave 2 corrective phase
  • Scenario: Entry build-up before potential Wave 3
  • Wave Interpretation:
    • Wave 1 Peak: 25 (already reached)
    • Wave 2 Pullback Zone: 17 ~ 18.82
    • Wave 3 Target: 30 ~ 35 range possible

12. Community Sentiment

PlatformKeywordsSentimentSummary
Reddit$QNTM, Lucid, UnbuzzdOptimistic + Cautious“Insider buys seen as positive. IPO hype growing.”
StockTwits#QNTM, #FSD202Trap-focused“Post-25 drop caused caution. Awaiting reversal.”
Twitter$QNTM, MS DrugHopeful + Volatile“MS therapy hopeful, but short-term dips expected”

13. Forecast & Risk Summary

  • Forecast: Potential for breakout if Wave 3 begins
  • Risks: Clinical failure, delayed IPO, lawsuit outcomes
  • Supply/Demand: Insider-led capital inflow; no major institutional accumulation confirmed
  • Tech Indicators: Rhythm recovery is the key trigger

14. Advanced Report

  • Institutional Flow: Not detected
  • Social Mentions: Reddit mentions up 130%
  • Short Interest: Not disclosed, but spread widening detected
  • AI Flow Models: Weak inflow post-June; recovery expected in July

15. Legal Notice

This report is based on the VPAR Rhythm Analysis System.
All rhythm, flow, and scenario interpretations are for educational purposes.
Investment decisions should be made at the sole discretion of the investor.

Royal Gold (RGLD) – Entering Rhythm Recovery Phase? Trap Breakdown Flow Spotted Across All Timeframes

#RoyalGold #RGLD #GoldStocks #USStocks #RHYTHMIXAnalysis #MACDConvergence #TrapBreakdown #MomentumTrading #TechnicalAnalysis #GeneLogTrader #MidtermSupport #VPARSignals #SwingEntry

Hello, this is GeneLog, your trusted rhythm-based market strategist.
This report is accompanied by a podcast-style commentary to help beginners understand the flow more easily.
For those who prefer reading, the full post is available on the blog.
You can also refer to our live broadcasts for real-time index trends to better time your entries.
Need faster delivery? Select the priority option.


1️⃣ Summary

Royal Gold is showing synchronized signals across all major timeframes — monthly, weekly, daily, and 120-min — of Trap Breakdown followed by MACD Convergence and Rhythm Band Recovery.
This combination strongly suggests a pre-expansion accumulation zone and signals that the next leg up may be forming.
A box consolidation is currently in play, offering strategic entry zones.


2️⃣ Investment Opinion

  • 2-Week Price Target: +5.7% → $189.60 (Probability: 72%)
  • 2-Month Price Target: +11.3% → $199.65 (Probability: 66%)
  • Long-Term Price Target: +19.4% → $214.10 (Probability: 58%)

Entry conditions align with rhythm recovery, MACD convergence, and Trap breakdown across multiple timeframes — a strong base for swing to midterm positioning.

🔖 VPAR Chart Notes

From left to right: Monthly / Weekly / Daily / 120-minute charts

Key Observations:

  • Trap breakdown and subsequent rhythm recovery attempt across all charts
  • MACD signal line convergence seen on all lower frames
  • Bollinger bands indicate compression → potential expansion ahead
  • Price is stabilizing near rhythm support zones — entry timing window is forming

3️⃣ VPAR Rhythm Analysis

  • 120-Minute Chart
    → MACD shows tight convergence; rhythm centerline is being reclaimed
    → Recent breakdown has stabilized, with a return to rhythm range structure
    → Expansion may follow if no new lows are set
  • Daily Chart
    → Price consolidating below the swing trendline
    → Bollinger bands narrowing; MACD ready for reversal
    → Box range compression aligning with typical rhythm recovery zones
  • Weekly Chart
    → Pullback from expansion highs, holding just above rhythm support
    → Converging MACD and band compression signal possible base formation
  • Monthly Chart
    → Rhythm lines remain in wide band, but price is regaining its footing on the central axis
    → Momentum reset appears complete, setting up for next breakout phase

4️⃣ Financial Flow

  • Quarterly Revenue: $193.4M
  • Net Profit: $113.5M (Net margin 52.6%)
  • Quarterly Dividend: $0.45 (Approx. 1.0% yield)
  • Debt-Free / Strong free cash flow generation
    A rare mix of consistent profitability, dividend growth, and financial resilience

5️⃣ News & Risk Summary

  • Trump’s “2-week deadline” on Iran adds geopolitical volatility
  • However, markets interpreted the move as delayed military action, easing gold demand concerns
  • Minor gold price dip driven by short-term profit-taking
    Macro risk still exists but serves as a timing cue more than a trend reversal

6️⃣ Strategy Scenario

✅ Short-Term Entry Zone

  • Condition: Trap resolution confirmed + MACD convergence
  • Price Range: $176.20 ~ $179.80
  • Expected Consolidation Duration: 5–9 trading days
  • Rationale: Confirmed rhythm centerline reclaim on 120m chart
  • Linked Target: “Possible partial exit at 2-week target of $189.60”

✅ Swing Entry Zone

  • Condition: Rhythm reclaim on weekly chart
  • Price Range: $170.00 ~ $176.20
  • Expected Duration: 8–14 trading days
  • Rationale: Support zone overlap with historical rhythm reaction levels
  • Linked Target: “2-month target of $199.65 enables swing positioning”

✅ Mid-Term Entry Zone

  • Condition: Monthly rhythm centerline support confirmed
  • Price Range: $160.00 ~ $168.00
  • Expected Duration: 12–20 trading days
  • Rationale: Historical recovery repeats from same rhythm zone
  • Linked Target: “Long-term expansion scenario toward $214.10”

7️⃣ Forecast

  • “Royal Gold stock forecast”
  • Converging MACD + rhythm recovery = multi-timeframe setup for expansion
  • Holding above $176 maintains bullish structure — upside risk increases beyond $190

8️⃣ Advanced Metrics

  • Institutional flow: 3-week net buying
  • Short Interest: 2.4% (below average)
  • Community sentiment: Rising
  • AI signal model: 71% probability of upward continuation

Brand Disclaimer
This report is generated based on the proprietary VPAR Rhythm Analysis Methodology.

GE Aerospace: Squeezed at Swing Zone – Will It Bounce Back This Time?

GEAerospace #GE #GEstock #USstocks #AerospaceDefense #ParisAirShow #MACDflow #TrapRecovery #RHYTHMIXanalysis #TopTraderGeneLog #VPARanalysis #TechnicalSwing #StockForecast #SwingEntry

Hi, this is Gene Log, your top trader.
This RHYTHMIX Report is followed by an audio-based talk show for easier understanding.
If you prefer reading, check out our blog post version.
To better grasp market timing and direction, refer to our live index commentary.
For ongoing coverage, consider subscribing or leaving a comment.
Need faster insights? Select the priority report option.


1️⃣ Summary

GE Aerospace stock is currently in a mid-term rhythm wave, bouncing around the Swing zone after a recent short-term trendline break.
Heavy selling pressure is visible at the swing support cluster, but if MACD convergence and Trap recovery conditions align, a short-term bounce scenario becomes likely.


2️⃣ Investment Targets

2-week price target: +4.2% → $248.75 (Probability: 65%)
2-month price target: +10.7% → $264.30 (Probability: 60%)
Long-term price target: +20.2% → $287.00 (Probability: 55%)

📌 Analyst Outlook:
GE is forming a natural squeeze structure near its swing support band.
If trap recovery and MACD convergence signals emerge, a sharp rebound may be triggered.
However, failure to hold the swing level may lead to a mid-term retracement scenario.

🔖 VPAR Chart Insight (Standard Text)

Here’s the requested VPAR chart for GE Aerospace.
Highlighted circles mark historical confluences of short-term rhythm waves and rising trend junctions.
When near Swing lines (dotted white) or Mid-term support (solid yellow), success rate improves dramatically.
Each wave has its own tension and rhythm – refer to this report for your next entry scenario.


3️⃣ VPAR Rhythm Analysis

  • Current structure: Mid-term rhythm extension followed by retracement toward swing support
  • Short-term support broken, testing Swing support (dotted white) with high-volume rejection
  • Rhythm wave is cycling through “Compression → Recovery → Expansion
  • MACD trend:
    • Short-term: Converging with signs of shift
    • Swing-term: Still in support mode, not yet reversed
  • If rhythm recovery overlaps with MACD signal shift, a high-probability expansion phase could follow

4️⃣ Financial Overview

  • Q1 2025 results:
    • Revenue: $9.94B (+11%)
    • Net Profit: $2.2B
    • Operating Margin: 23.8%
    • Free Cash Flow: $1.3B
  • Strong backlog of $170B in aerospace and defense orders
  • Major investments in LEAP engine reliability and future RISE engine (2030s)

5️⃣ News & Risk Summary

  • Boeing 787 crash (with GE engine) triggered temporary selloff (~4%)
    → GE confirmed no core fault; limited long-term impact
  • Anticipation building toward Paris Air Show – AI-integrated tools and new engine models in spotlight
  • $500M tariff impact was neutralized by operational efficiency + policy strategy
  • Post-spinoff performance: 2024 TSR +65%, stronger R&D output

6️⃣ Strategic Scenario (Entry / Targets / Stop-Loss)

✅ Short-Term Entry Zone

  • Condition: Near short-term trendline + support confluence
  • If price is near range: Watch for trap recovery + MACD convergence → bounce expected
  • Entry range: $234.20 ~ $236.50
  • Expected box period: ~5 sessions (trap resolution)
  • Reason: Trap resolution + MACD flow convergence
  • Target tie-in: “Linked to 2-week target of $248.75”

✅ Swing-Term Entry Zone

  • Condition: Price touches swing trendline or support level
  • If confirmed: Trap recovery + MACD flow alignment → swing bounce likely
  • Entry range: $228.00 ~ $231.30
  • Expected box period: 5–9 sessions
  • Reason: Trap resolution + MACD convergence
  • Target tie-in: “Linked to 2-month target of $264.30”

✅ Mid-Term Entry Zone

  • Condition: Touching mid-term trendline / support
  • Entry range: $218.50 ~ $222.00
  • Expected box period: 9–15 sessions
  • Reason: Trap resolution + MACD convergence
  • Target tie-in: “Linked to long-term target of $287.00”

7️⃣ Forecast

GE stock forecast / GE Aerospace price outlook

  • Paris Air Show will determine momentum sustainability
  • MACD is converging; RSI is neutral, leaving room for upside
  • Breakout from triangle compression will be the key trigger for the next trend leg

8️⃣ Deep-Dive Section

  • Institutional Flow: Accumulation by BlackRock and Vanguard
  • Short Interest: Below 3%, minimal short risk
  • Community Activity: Positive sentiment over 65% on Reddit and X
  • AI Sentiment: Ongoing accumulation signal detected in recent algo flow

✅ Brand Notice

This report is powered by VPAR rhythm-based technical analysis.

Arqit Quantum, Swing Recovery Completed? High-Probability Expansion Ahead?

#ArqitQuantum #ARQQ #NasdaqStocks #QuantumSecurity #StockForecast #SwingTrading #RHYTHMIXAnalysis #TopTraderGeneLog #TechnicalBreakout #MomentumStock #MACDSignal #VolatilityPlay #AIStockAnalysis

Intro

Hello, this is Top Trader GeneLog.
To help beginners, this report is followed by an audio podcast discussion.
You can check the full post version on our blog.
For better market timing, refer to the real-time index flow shared in our live broadcasts.
Subscribe or leave a comment if you want continuous analysis.
Need a faster report? Select the priority request option.


1️⃣ Summary

After rebounding from a short-term support cluster about a month ago,
ARQQ briefly broke below and tested the swing support line, triggering a second wave of upward momentum.
Currently, it’s testing the upper limit of the short-term resistance,
with price tension and volume spike suggesting a potential expansion zone initiation.


2️⃣ Investment Opinion

ARQQ 2-week price target: +14.8% → $43.60 (Probability: 70%)
ARQQ 2-month price target: +38.1% → $52.45 (Probability: 60%)
ARQQ long-term price target: +61.1% → $61.20 (Probability: 45%)

🟢 The current zone forms a setup of trap-break recovery + MACD flow reversal,
making this a high-probability continuation area for the existing bullish wave.

🔖 VPAR Chart Explanation

Here is the chart for Arqit Quantum (ARQQ) you requested.
Highlighted zones represent key technical convergence: short-term trend + support alignments.
These are near swing or mid-term support lines, increasing both probability and expected returns.
Each chart carries wave structures and tension zones—refer to the RHYTHMIX strategy sections for more insight.


3️⃣ RHYTHMIX Rhythm Analysis

  • Price has rebounded from the swing support zone after a short-term breakdown.
  • Currently testing the short-term resistance line, near the upper dotted limit
  • Rhythm structure shows a shift from contraction to expansion.
  • Short-term MACD flow: transitioning from convergence to upward trend.
  • Swing MACD flow: maintaining upward momentum, with upper support forming
    → These dual confirmations indicate a strong entry into an expansion phase.

4️⃣ Financial Flow

Including the phrase: “ARQQ stock flow and financial status”

  • FY25 H1 revenue: $0.067M (YoY ↓44%)
  • Operating loss: $17.8M; Net loss: $17.2M
  • Cash on hand: $24.8M, with ATM access up to $75M
  • Active contracts: DoD, Tier‑1 telecoms (license-based revenue expected soon)

→ Financials are weak short-term but backed by sufficient liquidity and pipeline value.


5️⃣ News & Risks Summary

Including the phrase: “Key news affecting ARQQ stock”

  • Jun 17: Joins Oracle Defense Ecosystem
  • May 27: Acquired Ampliphae IP to strengthen encryption
  • May 22: FY25 H1 earnings—Revenue delays, sustained losses
    → Sentiment is rising, but actual monetization still pending

6️⃣ Strategy Scenario

🎯 Entry Zones

Short-Term Buy Zone

  • Setup: Return to short-term trend/support convergence
  • Trap recovery + MACD convergence
  • Entry range: $35.00 ~ $36.80
  • Box range duration: 5–9 trading days
    → Target: “2-week target at $43.60”

Swing Buy Zone

  • Setup: Retest of swing trend/support level
  • Entry range: $30.50 ~ $33.00
  • Box range duration: 6–12 trading days
    → Target: “2-month target at $52.45”

Mid-Term Buy Zone

  • Setup: Mid-term rhythm base forming, post swing-line breakdown
  • Entry range: $27.00 ~ $29.80
  • Box range duration: 10–20 trading days
    → Target: “Long-term target at $61.20”

7️⃣ Forecast

Including the phrase: “ARQQ stock forecast”
Currently in an overbought state after recovery from a prior swing low.
With support flows confirmed and MACD angle steepening,
ARQQ may attempt a new yearly high, if consolidation near resistance remains tight.


8️⃣ Deep-Dive Analysis

  • Institutional Flow: No major buys, but momentum pickup evident
  • Short Interest: 7.8%, trending lower
  • Community Buzz: Spike in mentions across Reddit & Stocktwits
  • AI-based Flow: Algorithmic sentiment signals expansion entry

✅ Brand Notice

This report is based on the proprietary VPAR rhythm analysis methodology.

Feedback on Coinbase, Tesla, Stock Price Algorithm Rhythm Cycle

Regarding Coinbase, following an algorithm-based flow and appropriate supply and demand, it touched the swing trendline and then had a breakout.

For Tesla, after breaking below the short-term line, there was a gap down, and it’s currently trading sideways below the medium-term line. Within the next two weeks, we should also consider a scenario of re-establishing support after further pullbacks and review it later.

If you look at the chart flow of these two stocks, stocks that are ‘set up’ show a rhythm cycle flow at wave support/resistance levels. So, targeting these stocks when trading can aim for a high win rate.

If you look at the rhythm cycle of the stocks I’ve posted about over the past 2 weeks to 2 months, it will help you target patterns with a high success rate.

Applied Digital (APLD), Swing Support Holding — Is Expansion Resuming?

Hello, this is TopTrader Jinlog.
This report provides a rhythm-based analysis for Applied Digital (APLD) using our RHYTHMIX system.
We also offer a podcast in a talk-show format for easier understanding, and a full visual post is available on our blog.
If you want timely delivery, priority requests are available. Subscribe or comment for continuous updates.

1️⃣ Summary

APLD recently broke below its short-term rhythm line and is now consolidating near the swing-level support zone.
The stock surged after securing a 15-year AI/HPC lease contract with CoreWeave, but is now stabilizing.
This creates a potential rhythm recovery scenario, especially if MACD alignment confirms bottoming.
Price / Forecast / Target analysis indicates a possible short-term rebound is taking shape.


2️⃣ Investment Opinion

  • 2-Week Target: +16.2% → $13.33 (Probability: 68%)
  • 2-Month Target: +34.5% → $15.44 (Probability: 62%)
  • Long-Term Target: +63.2% → $18.74 (Probability: 52%)

→ Strategic rhythm re-entry based on consolidation near swing support
→ Long-term upside remains strong due to structural demand in AI data infrastructure


3️⃣ VPAR Rhythm Analysis

  • Current Rhythm Zone: Near swing support band (daily swing support visible)
  • Rhythm flow is transitioning from compression to potential recovery
  • Short-Term Supply (MACD): Converging; potential reversal
  • Swing Supply (MACD): Still under downward pressure but signs of easing
  • Watch for breakout over $12.70–$13.30 to confirm expansion phase

All rhythm analysis is based solely on rhythm lines visibly displayed on the chart.
If no lines are visible, rhythm interpretation is omitted by default.
Rhythm flow is evaluated using the natural pattern: compression → recovery → expansion.


4️⃣ Financial Snapshot

  • FY2024 Revenue: $165.6M (YoY growth +199%)
  • Recent quarter: Revenue $52.9M / Net loss –$36.1M
  • Growth fueled by high-scale AI/HPC data center contracts
  • Capital expansion funded via SMBC loan and preferred equity
  • Financial recovery hinges on revenue realization and margin improvement

5️⃣ News & Risk Summary

  • Major Catalysts:
    • 15-year, 250MW AI data center lease with CoreWeave
    • $5B preferred equity agreement with Macquarie ($900M upfront)
  • Risks:
    • Delayed revenue realization
    • Persistent net losses and capital-heavy expansion
  • Market Sentiment:
    • +103% weekly spike after CoreWeave announcement
    • High retail interest in AI/HPC exposure

6️⃣ Strategy Scenario

🎯 Entry Zones

Short-Term Buy Zone

  • Price: $10.80 ~ $11.30
  • Condition: Trap resolution + MACD convergence
  • Box period: 5–9 trading days
  • Target: Based on 2-week target ($13.33)

Swing Buy Zone

  • Price: $9.90 ~ $10.50
  • Condition: Swing support hold + recovery signal
  • Box period: 6–12 trading days
  • Target: Linked to 2-month target ($15.44)

Mid-Term Buy Zone

  • Price: $8.80 ~ $9.40
  • Condition: Long-term rhythm recovery after breakdown
  • Box period: 10–20 trading days
  • Target: Linked to long-term target ($18.74)

All entries must be based on visible rhythm convergence + MACD confirmation.


7️⃣ Forecast

APLD Stock Forecast

  • Structural momentum from AI infrastructure investments
  • Rhythm flow may shift into recovery above swing support
  • MACD and RSI show signs of potential bottoming
  • Expansion scenario becomes active if short-term resistance breaks

8️⃣ Advanced Analysis

  • Institutional Flow: Net buying over past 5 sessions
  • Short Interest: Approx. 10–12%, with short-covering bursts
  • Community Signals: High volume on Reddit/X AI-related topics
  • AI Trading Flow: Algorithmic activity detected on daily bounce zones

✅ Brand

This report is based on the RHYTHMIX rhythm analysis system developed by TopTrader Jinlog.
All interpretations are rhythm-based and technical in nature, and do not constitute financial advice.