#BWXT #NuclearEnergy #DefenseStocks #TechnicalAnalysis #RHYTHMIXReport #CleanTech #SwingTrading #StockBreakout #InstitutionalFlow #USMarket
Hello, this is Top Trader Jinlog.
You can view the report conveniently with charts on the blog.
For ongoing market analysis, feel free to subscribe or leave a comment.

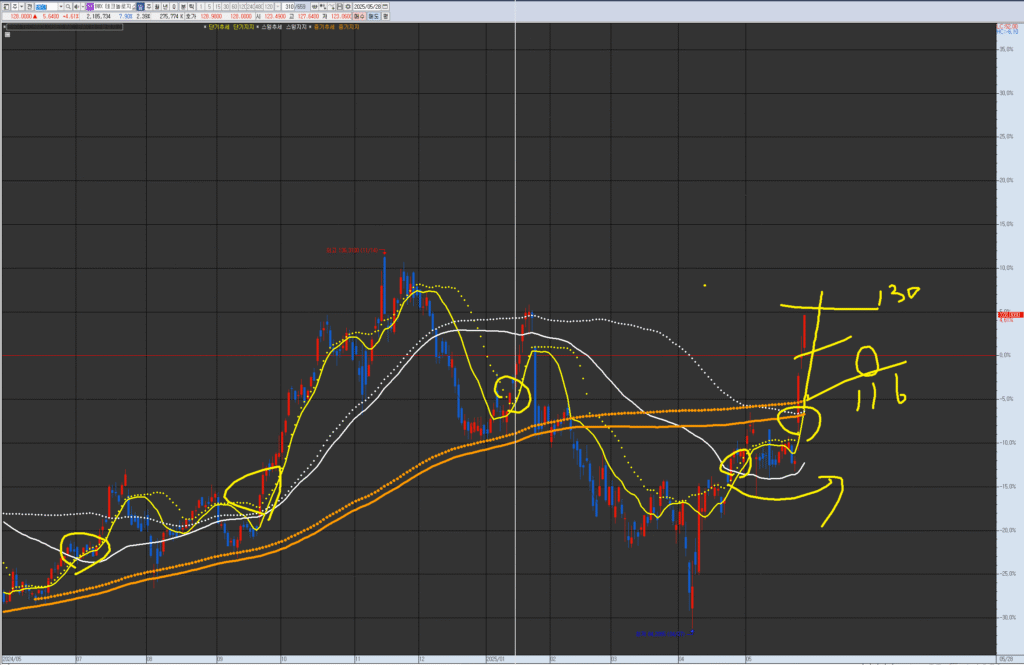
VPAR Chart Explanation This is BWX Technologies (BWXT), as requested for analysis. The circled areas in the past and present are potential short-term trend (yellow) consolidation and upward trend points. These points have a higher probability and potential return when they are near the swing line (white) or medium-term line (orange). Each chart has its own wave tension and trend. Currently, it has re-entered the medium-term line after breaking below it and is in a short-term trend. If it holds support at 116, we can see the possibility of an upward-sloping box pattern within the medium-term (monthly wave) trend again. There is currently a gap with the short-term line. Consider trading for further upside during a correction close to the short-term line above 130, or if it breaks below the short-term line, consider it a potential buying point on a dip at 116.
💡 Investment Opinion
BWXT is benefiting from a structural shift in U.S. energy policy and steady financials,
positioning itself for continued upside momentum.
- 2-week expected return: +6.7% → $136.60 (Probability 68%)
- 2-month expected return: +14.8% → $147.00 (Probability 62%)
- 2-year long-term target: +41.4% → $181.00 (Probability 58%)
1. Summary
- BWXT is rallying on expectations tied to U.S. nuclear infrastructure initiatives.
- The current overbought condition could bring a short-term cooldown.
- Medium-term rhythm remains intact, and structure is bullish.
2. 📊 V.P.A.R Interpretation (Visual Phase Alignment Rhythm)
- 🔵 Monthly: Bollinger top breakout, followed by cooling period
- 🟡 Weekly: Post-3-wave rally, in consolidation; breakout retest possible
- 🟠 Daily: Trading between $120–$128 consolidation zone
- 🔴 120min: Still aligned in short-term uptrend; overextension likely to ease
Conclusion: Overbought short-term, but rhythm remains bullish
→ Re-entry possible on dip / $125 key zone to watch
3. 📈 RHYTHMIX Rhythm Analysis
⏳ Monthly
- Strong top expansion in Bollinger Bands
- RSI in overbought region; $130+ may trigger soft pullback
- Trendline support in $113–$117 zone
📉 Weekly
- Momentum high; MACD topping
- Positive alignment of trend lines
- Watch for pullback if $125 is broken / resistance at $138.2
⏱ Daily
- Centerline holding at $124.5–$126.5
- Volume thinning in consolidation
- Still respecting structure — reacceleration possible on breakout
🕐 120-Minute
- Short-term trend intact with slight MACD reset
- Narrowing consolidation may lead to breakout
- Price above $127 could trigger short-term rally extension
4. 💰 Financial Overview
- Q1 2025 Revenue: $682.3M (+13% YoY)
- Net Income: $75.5M
- Adjusted EBITDA: $129.8M
- EPS: $0.91 (beat expectations)
- 2025 Guidance: EPS range of $3.40–$3.55 maintained
5. ⚠️ News & Risk Summary
- U.S. executive order boosts nuclear infrastructure momentum
- Acquisition of Kinectrics Inc. to enhance nuclear services & radiopharmaceutical reach
- Nuclear regulatory risks remain
- High price perception may prompt short-term profit-taking
6. 🧠 Strategy Scenario
🎯 Entry Zone
$124.00 ~ $127.00
→ Strong structural support + rhythm consolidation zone (Probability 69%)
🎯 Targets
- Target 1: $136.60 (Probability 68%)
- Target 2: $147.00 (Probability 62%)
- Long-Term: $181.00 (Probability 58%) – supported by structural trend + policy flows
🚫 Stop-Loss or Response
- Drop below $121.00 may signal structural weakness
→ If accompanied by falling volume, initiate defensive exit (Probability 76%)
7. 🌈 Outlook (Emotional Rhythm Commentary)
Policy provides the direction.
Rhythm turns that direction into conviction.
BWXT may be taking a short breath,
but it’s aligned with a much larger trend—nuclear renaissance.
8. 🧩 Deep Dive Report (Member-Only)
📌 Institutional Flow
- BlackRock, State Street showing net buys
- $100M+ net institutional inflow in past 4 weeks
📌 AI Forecasting
- Danelfin AI Score: 6.5/10 (Buy Bias)
- 3-month outperformance probability: 41.2%
📌 Industry Trends
- U.S. nuclear projects expanding in energy + defense sectors
- Growing importance of space nuclear propulsion and microreactors
📌 Analyst Target Price
- Average price target: $145–$152
- New high-end analyst target raised to $160
