#RoyalGold #RGLD #GoldStocks #USStocks #RHYTHMIXAnalysis #MACDConvergence #TrapBreakdown #MomentumTrading #TechnicalAnalysis #GeneLogTrader #MidtermSupport #VPARSignals #SwingEntry
Hello, this is GeneLog, your trusted rhythm-based market strategist.
This report is accompanied by a podcast-style commentary to help beginners understand the flow more easily.
For those who prefer reading, the full post is available on the blog.
You can also refer to our live broadcasts for real-time index trends to better time your entries.
Need faster delivery? Select the priority option.
1️⃣ Summary
Royal Gold is showing synchronized signals across all major timeframes — monthly, weekly, daily, and 120-min — of Trap Breakdown followed by MACD Convergence and Rhythm Band Recovery.
This combination strongly suggests a pre-expansion accumulation zone and signals that the next leg up may be forming.
A box consolidation is currently in play, offering strategic entry zones.
2️⃣ Investment Opinion
- 2-Week Price Target: +5.7% → $189.60 (Probability: 72%)
- 2-Month Price Target: +11.3% → $199.65 (Probability: 66%)
- Long-Term Price Target: +19.4% → $214.10 (Probability: 58%)
→ Entry conditions align with rhythm recovery, MACD convergence, and Trap breakdown across multiple timeframes — a strong base for swing to midterm positioning.

🔖 VPAR Chart Notes
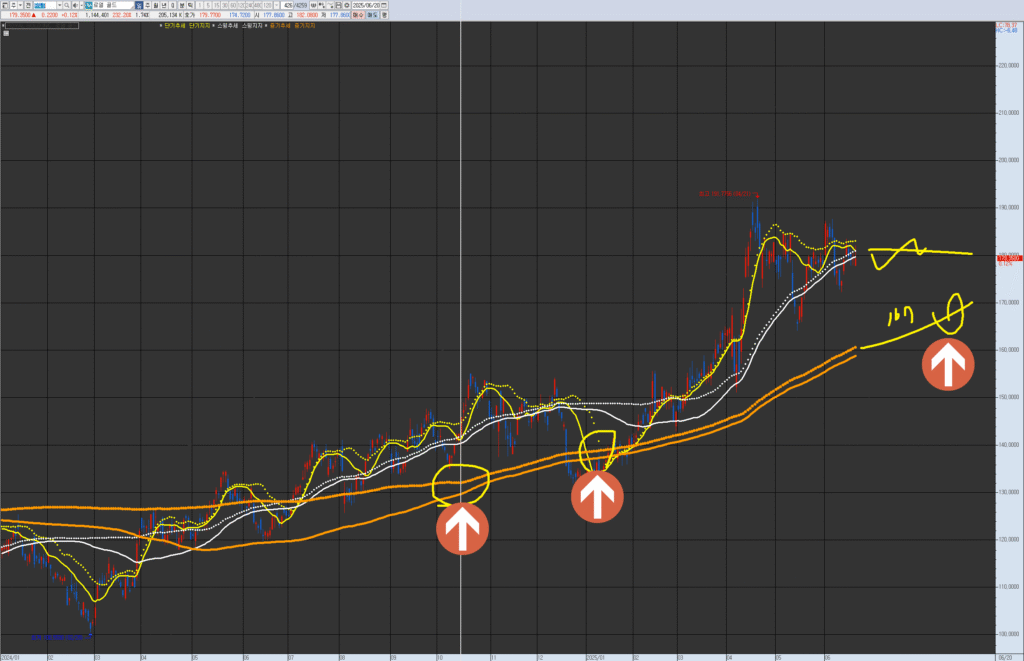
From left to right: Monthly / Weekly / Daily / 120-minute charts
Key Observations:
- Trap breakdown and subsequent rhythm recovery attempt across all charts
- MACD signal line convergence seen on all lower frames
- Bollinger bands indicate compression → potential expansion ahead
- Price is stabilizing near rhythm support zones — entry timing window is forming
3️⃣ VPAR Rhythm Analysis
- 120-Minute Chart
→ MACD shows tight convergence; rhythm centerline is being reclaimed
→ Recent breakdown has stabilized, with a return to rhythm range structure
→ Expansion may follow if no new lows are set - Daily Chart
→ Price consolidating below the swing trendline
→ Bollinger bands narrowing; MACD ready for reversal
→ Box range compression aligning with typical rhythm recovery zones - Weekly Chart
→ Pullback from expansion highs, holding just above rhythm support
→ Converging MACD and band compression signal possible base formation - Monthly Chart
→ Rhythm lines remain in wide band, but price is regaining its footing on the central axis
→ Momentum reset appears complete, setting up for next breakout phase
4️⃣ Financial Flow
- Quarterly Revenue: $193.4M
- Net Profit: $113.5M (Net margin 52.6%)
- Quarterly Dividend: $0.45 (Approx. 1.0% yield)
- Debt-Free / Strong free cash flow generation
→ A rare mix of consistent profitability, dividend growth, and financial resilience
5️⃣ News & Risk Summary
- Trump’s “2-week deadline” on Iran adds geopolitical volatility
- However, markets interpreted the move as delayed military action, easing gold demand concerns
- Minor gold price dip driven by short-term profit-taking
→ Macro risk still exists but serves as a timing cue more than a trend reversal
6️⃣ Strategy Scenario
✅ Short-Term Entry Zone
- Condition: Trap resolution confirmed + MACD convergence
- Price Range: $176.20 ~ $179.80
- Expected Consolidation Duration: 5–9 trading days
- Rationale: Confirmed rhythm centerline reclaim on 120m chart
- Linked Target: “Possible partial exit at 2-week target of $189.60”
✅ Swing Entry Zone
- Condition: Rhythm reclaim on weekly chart
- Price Range: $170.00 ~ $176.20
- Expected Duration: 8–14 trading days
- Rationale: Support zone overlap with historical rhythm reaction levels
- Linked Target: “2-month target of $199.65 enables swing positioning”
✅ Mid-Term Entry Zone
- Condition: Monthly rhythm centerline support confirmed
- Price Range: $160.00 ~ $168.00
- Expected Duration: 12–20 trading days
- Rationale: Historical recovery repeats from same rhythm zone
- Linked Target: “Long-term expansion scenario toward $214.10”
7️⃣ Forecast
- “Royal Gold stock forecast”
- Converging MACD + rhythm recovery = multi-timeframe setup for expansion
- Holding above $176 maintains bullish structure — upside risk increases beyond $190
8️⃣ Advanced Metrics
- Institutional flow: 3-week net buying
- Short Interest: 2.4% (below average)
- Community sentiment: Rising
- AI signal model: 71% probability of upward continuation
✅ Brand Disclaimer
This report is generated based on the proprietary VPAR Rhythm Analysis Methodology.
