#NASDAQ100 #NDXAnalysis #MarketOutlook #RHYTHMIXReport #ChartBreakout
#USFutures #SwingSupport #DottedResistance #TopTraderGeneLog #FibonacciSupport
Hello, this is Top Trader GeneLog.
You can follow the chart-based insights directly on the blog, and live updates on index flow are shared through our real-time broadcast.

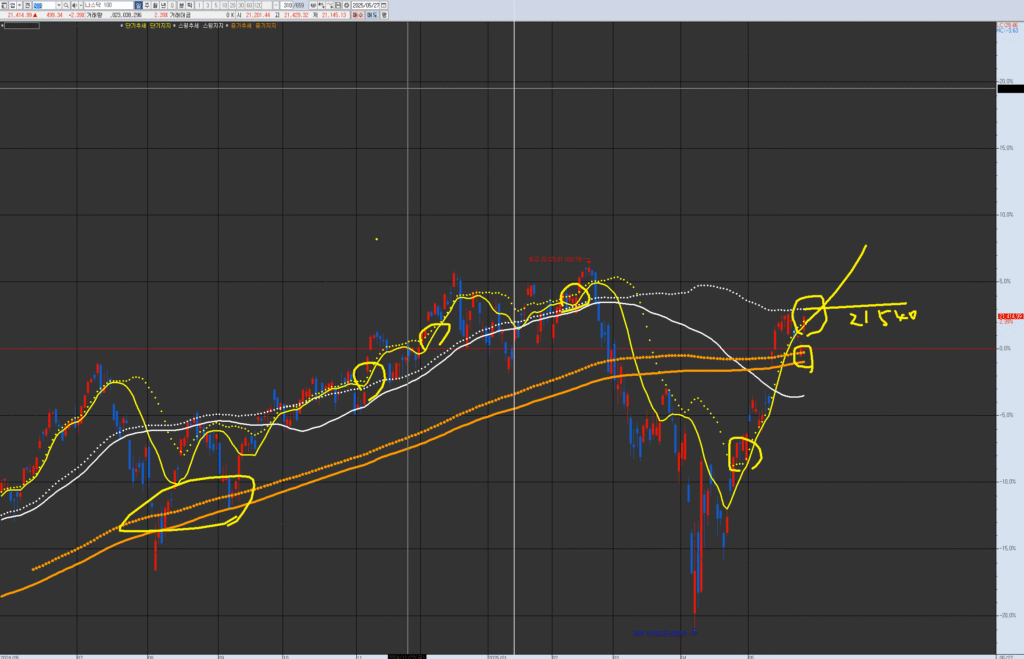
VPAR Chart Explanation This is the NASDAQ-100 chart. The circled areas in the past and present are potential short-term trend turning points; consolidation coupled with an upward trend represents a trading entry point. Each chart has its own wave pattern/trend. Following the rebound from the medium-term resistance/supply level mentioned last week, it is now showing a pattern of re-establishing itself on the short-term line. The trading point is focused on checking whether the swing support line at 21,540 is broken through within approximately one week.
1. 📈 Phase Core – Pre-Market Highlights (Phase Shift)
The NASDAQ 100 closed the previous session with a strong upward reversal (+2.28%).
As of the pre-market, it’s hovering at 21,476 and re-approaching the swing support dotted line at 21,540.
Asian markets closed mixed; Europe slightly weakened with consumer sectors lagging.
U.S. futures are tilting bullish, led by tech—suggesting a possible micro-phase reversal in rhythm.
2. ⏱ Alignment View – U.S. Indices in Sync
- S&P 500 Futures: +0.2%
- NASDAQ 100 Futures: +0.5%
- Dow Futures: +0.1%
The rhythm across major indices is synchronized bullish, and NASDAQ 100 is pacing the charge as it tests above key swing trendline zones.
3. 🌀 Rhythm Trap – Sector Rotation Highlights
- AI / Semiconductors: Eyeing a new breakout near resistance
- Fintech / Consumer: Potential rebound entry from recent dips
- Energy / Commodities: Pullback in oil = resistance test ongoing
- Financials: Sideways consolidation amid rate fluctuation moderation
4. 🧭 Visual Mapper – Technical Flow Reconnection
- 120-min Chart: Holding above centerline; breakout retest of swing support dotted line (21,540) with RSI+MACD aligning
- Daily Chart: 3x rejection at the short-term trendline (yellow solid) with price compressing → breakout = explosive
- Weekly Chart: Trend remains up, price sitting between swing trendline (white solid) and dotted zone
🟨 Note: Short-term support = yellow dotted line
⬜ Swing support = white dotted line
5. 🎯 Strategic Scenario (Entry / Targets / Stop-Loss)
💡 Based on RHYTHMIX Ver 6.9 + Fibonacci / RSI as supplemental logic
| Type | Range / Value | Rationale |
|---|---|---|
| Entry | $21,350 – $21,420 | Above centerline with volume rebound confirmation |
| Target ① | $21,750 | Dotted breakout and resistance compression |
| Target ② | $22,320 | Expansion near 161.8% Fibonacci swing projection |
| Stop-Loss | $21,180 break below | Centerline loss with RSI<50, MACD rollover risk |
6. 🔍 RHYTHMIX Rhythm Summary (Ver 6.9)
- Monthly: Macro rhythm stable, candle length extension evident
- Weekly: Sitting just below resistance band; RSI cooling but not reversing
- Daily: Compression below dotted line, 3rd tap rhythm supports reversal
- 120-min: Early breakout rhythm, MACD crossing + RSI 61 → risk-on bias
7. 📊 Technical Indicators Summary
- RSI(14): 62.4 – Entering strong trend confirmation zone
- MACD(12,26): +45.2 – Still expanding
- ADX(14): 28.3 – Healthy momentum level
- Stochastic(9,6): 91.1 – Overbought, but consistent with trend continuations
- Fibonacci Zone (Swing): $22,320 ≈ 161.8% from $20,850–$21,420 impulse
8. 📰 Macro & News Summary
- PCE Data (May 31): Expected at +0.3% MoM, a key inflation trigger
- FED Watch (May 29): Scheduled Fed speakers may shift tone on rate path
- Tech Drivers: NVDA, MSFT, AAPL maintain heavy order flow into Q2 close
💬 Comment (Emotional Closing Block)
“You’re walking above the dotted line.
What holds in rhythm today, may rise as the next wave tomorrow.”
