#GRRR #GorillaTech #SmallCapStock #AIstocks #SurveillanceTech #ReversalPlay #TechnicalBreakout #RHYTHMIXReport
Hello, this is Jinlog.
This report provides a comprehensive analysis of Gorilla Technology Group Inc., focusing on technical rhythms, financial health, and strategic outlooks.

Chart Explanation
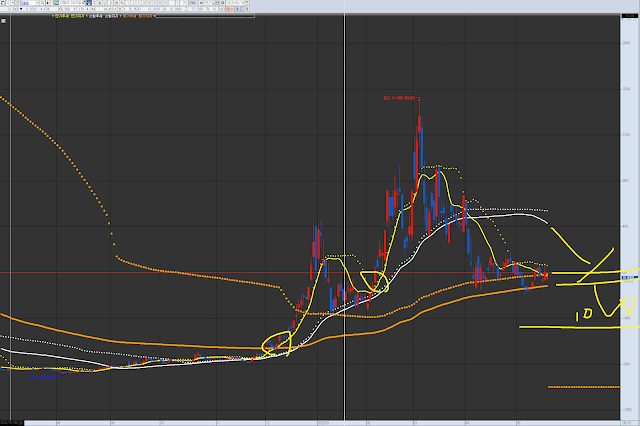
This is GRRR Gorilla Technology Group, which you requested in the comments.
The circled areas in the past and present show potential short-term trend entry points, where merging trends and an upward trend align.
Each chart has its own wave pattern and trend.
Currently, after the first wave, it is consolidating at the mid-term support/resistance level. Checking for support within approximately two months is needed, or if it further declines near $10, it becomes a consideration point for range trading aimed at a rebound.
📌 Investment Opinion
Gorilla Technology Group Inc. (GRRR) has experienced significant volatility in 2025. After reaching a high of $30.55 in February, the stock has retraced to the $16.86 level. Technical indicators suggest a potential consolidation phase, with the possibility of a reversal if key resistance levels are breached.
- 2-week expected return: +7.5% (probability: 52%)
- 2-month expected return: +21.4% (probability: 46%)
- 1-year expected return: +58% (probability: 62%)
1. Summary
Gorilla Technology specializes in AI-driven security and surveillance solutions. The company has expanded its operations globally, with a presence in Southeast Asia, India, the Middle East, Europe, North America, and Latin America. Despite a net loss in 2024, Gorilla has strengthened its financial position and continues to invest in growth initiatives.
2. Technical Rhythm Analysis
🕰️ Monthly Chart:
- Significant decline from 2022 highs, followed by a stabilization phase.
- Formation of a potential base suggests the possibility of a trend reversal.
📉 Weekly Chart:
- Consolidation within the $15.5–$18.2 range.
- Momentum indicators (MACD, RSI) show signs of bullish divergence.
📉 Daily Chart:
- Price action indicates a tightening range, often a precursor to a breakout.
- Bollinger Bands narrowing, suggesting decreased volatility and potential for a significant move.
⏱️ 120-Minute Chart:
- Short-term resistance observed around $17.20.
- Support established near $16.60, providing a defined trading range.
3. Financial Pulse (Ver 6.4)
- 2024 Revenue: $74.7 million (+15.4% YoY)
- Net Loss: $63.9 million
- Cash Position: $37.47 million
- Total Debt: $21.4 million
- Total Assets: $153.8 million
- Equity: $73.1 million
Valuation Metrics:
- P/E Ratio: N/A (due to net loss)
- EV/EBITDA: 12.7x
- ROE: -87%
- ROA: -41%
- Liquidity: Adequate, with improved cash reserves
4. News & Risk Summary
- Strategic Partnerships: Collaboration with Toyota’s logistics division in Thailand to develop smart warehouse solutions.
- Financial Compliance: Achieved full Sarbanes-Oxley compliance, enhancing financial transparency and governance.
- Global Expansion: Rapid growth in emerging markets, with a focus on AI infrastructure development.
- Risks: Continued net losses and market volatility pose challenges; however, improved financial controls mitigate some concerns.
5. Strategic Scenario
- Entry Zone: $15.80–$16.50
- Target Prices:
- $20.50 (short-term)
- $25.00 (medium-term)
- Stop-Loss: $14.90
🔮 Outlook
Gorilla Technology is positioned to capitalize on the growing demand for AI-driven security solutions. While financial performance has been challenged, strategic initiatives and global expansion efforts provide a foundation for potential recovery and growth.
🧩 Deep-Dive Insights
- Institutional Activity: Limited institutional ownership; monitoring for increased interest.
- Short Interest: Low, reducing the risk of short squeezes.
- Analyst Ratings: Consensus price target of $31.00, indicating potential upside.
