#Uber #Robotaxi #USstocks #MomentumPlay #BreakoutStock #TechnicalAnalysis #GrowthStock #EarningsSurprise #RHYTHMIXReport
Hello, this is Jinlog.
You can view this full chart and report visually on the blog.
For more reports, feel free to leave comments or subscribe.

Chart Explanation
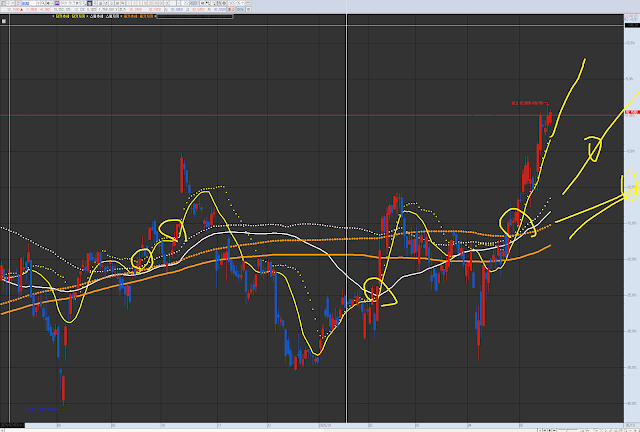
This is UBER (UBER), which you requested in the comments.
The circled areas in the past and present show potential short-term trend entry points. A confluence of merging trends and an upward trend indicate an entry point.
Each chart has its own wave pattern and trend.
Currently, due to supply and demand tension up to the mid-term trend, if the short-term line is breached, re-entering at the swing line or mid-term trend line is worth considering.
Investment Opinion
Uber recently broke its 52-week high, supported by strong earnings and institutional confidence.
Momentum is technically strong, but short-term overbought signals and resistance zones must be respected.
- 2-week expected return: +4.2% (probability: 54%)
- 2-month expected return: +11.8% (probability: 48%)
- 1-year expected return: +38.3% (probability: 66%)
1. Summary
Uber is driving a strong rally on the back of robotaxi initiatives, autonomous vehicle partnerships, and Uber Eats expansion.
The sudden swing to profitability, along with institutional buying, signals potential structural upside.
2. Technical Rhythm Analysis
🕰️ Monthly Chart:
- Broke multi-year resistance (2021–2024 range)
- Three consecutive bullish candles, top-band expansion forming
- Setup signals long-term trend reversal confirmed
📉 Weekly Chart:
- Strong volume breakout past $60
- All moving averages now in golden cross alignment
- RSI reaching overbought territory → watch $85–88 zone for pullbacks
📉 Daily Chart:
- Breakout above $92 after consolidation
- MACD, CCI remain bullish
- Price entering prior congestion zone near all-time high → minor resistance likely
⏱️ 120-Minute Chart:
- Gap-up and tight flag formation
- Holding upper Bollinger Band → breakout potential in next 2 sessions
- Minor consolidation still bullish unless $88 breaks
3. Financial Pulse (Ver 6.4 – Updated)
- 2024 Revenue: $43.98B (+17.96% YoY)
- Net Income: $9.86B (+422.3% YoY)
- EPS: $4.56
- Leverage & liquidity: Stable
➕ Valuation & Ratios
- P/E (TTM): 16.32
- Forward P/E: 32.24
- P/B: 8.80
- ROE: 60.08%
- ROA: 21.92%
- EV/EBITDA: 42.27
- FCF Yield: Improving post-profitability
4. News & Risk Summary
- 📌 Bill Ackman’s $2.2B investment via Pershing Square confirms institutional trust
- 📌 VW ID. Buzz robotaxi pilot in LA starting 2026
- 📌 New feature release: ‘Savings Slider’, ‘Price Lock’, ‘Route Share’
- ⚠ Short-term overbought levels, $93–95 zone = potential resistance
5. Strategic Scenario
When · Why · How Much:
- Entry Zone: $87.5–$89.2 (entry prob: 61%)
- After minor pullback/consolidation
- Targets:
- $97.00 (target prob: 62%)
- $104.00 (target prob: 48%)
- Stop-Loss: $83.20 (breakdown prob: 59%)
- Below $80 = trend failure risk
🔮 Outlook
Uber appears to be transitioning from a growth story to a value + profitability leader.
Short-term volatility may test recent gains, but long-term prospects remain bright.
The ideal approach: scale-in strategy with firm stop at $83 and eyes on breakout toward $100+.
🧩 Deep-Dive Insights (Institutional Flow + Sentiment)
- Institutional inflow rising post-Q1
- Retail traders fueling near-term gains
- RSI/Slow Stoch in overheated territory
- Analyst consensus price: $106.4
- Risk-reward remains positive if structure holds above $85
