#Tesla #TSLA #Robotaxi #TrendReversal #TechnicalSetup #MACDCrossover #EVStocks #RHYTHMIXReport
Hello, this is Jinlog.
Visit the blog to review full visuals and layered chart analysis.
For more timely updates, feel free to subscribe or leave comments.

Chart Explanation
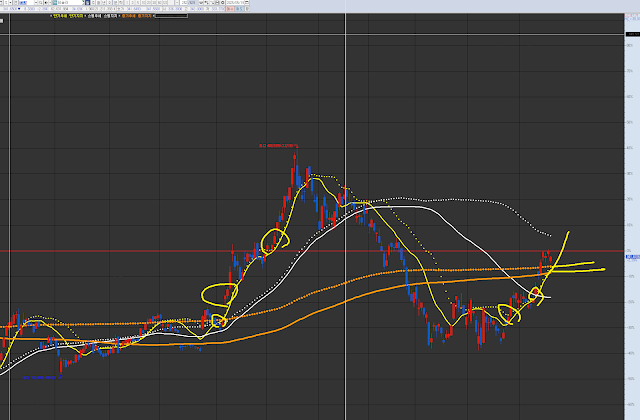
This is Tesla (TSLA).
The circled areas in the past and present show potential short-term trend entry points. A confluence of merging trends and an upward trend indicates an entry point.
Each chart has its own wave pattern and trend.
In the short-term trend, it is above the mid-term resistance level and near the short-term line, currently in an overbought state. Checking the trend’s support flow is necessary.
Investment Opinion
Tesla is entering a potential trend reversal phase with short-term momentum showing strong signs of recovery.
Golden cross formations across moving averages and a bullish MACD crossover support the rebound.
However, intermediate resistance remains strong, and any reversal from current levels must be closely monitored.
- 2-week expected return: +4.5% (probability 56%)
- 2-month expected return: +12.3% (probability 49%)
- 1-year expected return: +38.7% (probability 67%)
1. Summary
TSLA has bounced strongly despite weak earnings, supported by robotaxi expectations and energy storage segment growth.
The rebound structure mirrors previous recovery waves, though political risk and insider selling continue to weigh on sentiment.
2. Technical Rhythm Analysis
📊 Daily Chart Analysis
🔹 Structural Setup
- Recent price movement resembles prior breakout wave (marked by 3 circled zones in chart)
- Current rebound phase mirrors previous post-correction lift-offs
- Clean upward alignment of short-term MAs
🔹 Moving Averages
- 5/10/20-day MA golden cross established
- 60-day MA breakthrough confirmed
- Currently testing resistance at 120-day MA
🔹 Indicators
- MACD histogram crossed above 0 line + signal line → bullish momentum
- Bollinger Band top expansion underway
- Minor pullbacks interpreted as healthy shakeouts
3. Financial Pulse
- Q1 Revenue: $19.3B (-9% YoY)
- EPS: $0.27 (missed $0.42 est.)
- Auto revenue down 20%, Energy Storage up 67%
- Net profit: $850M (-71% YoY)
- Strong divergence between core auto and energy segments
4. News & Risk Summary
- Robotaxi service to begin in June in Texas (Model Y based)
- Political controversy impacts brand image (CA sales down 21%)
- Ross Gerber & Third Point both sold large Tesla positions
- Market questioning Elon Musk’s focus
5. Strategic Scenario
When · Why · How Much — summarized:
- Entry Zone: $330–$336 (entry probability: 63%)
- Favorable support area post-golden cross
- Targets:
- $360 (reach probability: 61%)
- $388 (reach probability: 43%)
- Stop-Loss: $316 (breakdown probability: 58%)
- Below this line, trend reversal may fail
🔮 Outlook
Tesla is entering a potentially explosive rebound phase, backed by technical momentum and growth segments.
However, strong overhead resistance and political noise must be navigated.
The safest approach is staggered entry, close tracking of $316 support, and reassessing near $360–388 levels.
🧩 Deep-Dive Report (Institutional Flow & Sentiment)
- Institutional inflows returning, short interest retreating
- RSI nearing overbought — minor pullback expected
- Elon Musk’s public image continues to affect sentiment
