#TMC #DeepSeaMining #EnergyTransition #SpeculativeStock #TechnicalBreakout #EnvironmentalImpact #NASDAQ #RHYTHMIXReport
Hello, this is Jinlog.
For full visual context, visit the blog where you can view charts and ongoing breakdowns.
If you’d like continuous updates, feel free to subscribe or leave a comment.

Chart Explanation
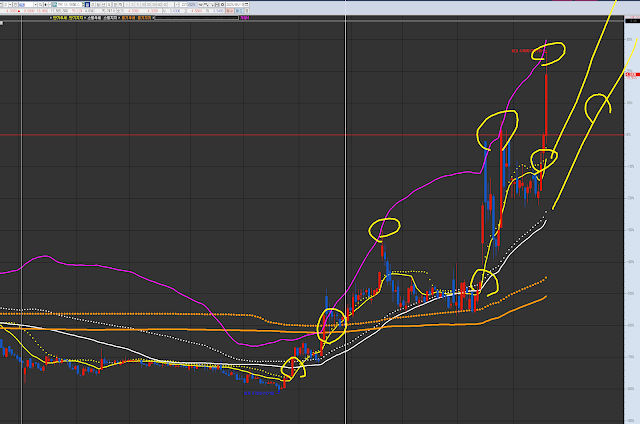
This is TMC, which I have mentioned multiple times.
The circled areas in the past and present show potential short-term trend entry points. A confluence of merging trends and an upward trend indicate an entry point.
Each chart has its own wave pattern and trend.
TMC has been consistently maintaining an upward wave in its mid-term trend.
Today, it touched the resistance level in the purple overbought zone. In case of a short-term trend divergence correction or breakdown, the entry point will be near the swing line or mid-term line around $3 again.
Investment Opinion
TMC has experienced a sharp rally driven by expectations around deep-sea mining and recent regulatory moves.
While the momentum is strong, the stock appears overheated, and financial fundamentals remain weak.
Ideal for short-term trades or entry after a healthy pullback.
- 2-week expected return: +4.2% (probability 49%)
- 2-month expected return: +16.5% (probability 52%)
- 1-year expected return: +38% (probability 68%)
1. Summary
TMC skyrocketed over 300% in recent weeks, fueled by application for a U.S. deep-sea mining license, positive environmental assessment news, and a $37M equity raise.
Yet the company still has no revenue, and is navigating early-phase commercialization risks.
2. Technical Rhythm Analysis
🕰️ Monthly Chart:
- Broke long-term base, signaling structural reversal
- Mid-term moving averages crossed upward, Bollinger bands expanding
- RSI and MACD just flipped neutral → bullish setup
📉 Weekly Chart:
- Explosive breakout beyond mid-term resistance
- Volume confirms conviction, momentum very strong
- Approaching top Bollinger zone → near-term overheating
📉 Daily Chart:
- Gap-ups with full-bodied bullish candles
- No short-term consolidation — trend acceleration evident
- MACD histogram peaking → signs of topping
⏱️ 120-Minute Chart:
- Max overbought; now showing zigzag-style local correction
- Price clings to upper band → poised for either renewed surge or breakdown
- Next direction hinges on whether $4.00 zone holds
3. Financial Pulse
- No revenue; pre-revenue stage business
- Q1 Net Loss: $20.6M / Cash: $43.8M
- Recent $37M equity raise at $3.00/share (warrants at $4.50)
- Operates as a high-risk, high-hype narrative stock
4. News & Risk Summary
- Filed official U.S. deep-sea mining application
- Positive environmental assessment triggered +17% gain
- Analysts (e.g. A.G.P.) raised target to $6.25
- Still facing backlash from environmental groups + speculative valuation
5. Strategic Scenario
Summarized by When · Why · How Much:
- Entry Zone: $3.90–$4.20 (Entry Probability: 59%)
- Post-gap retracement likely to retest support
- Targets:
- $5.00 (Reach Probability: 64%)
- $6.20 (Reach Probability: 42%)
- Stop-Loss: $3.55 (Breakdown Probability: 60%)
- Close gap or trend breakdown risk
🔮 Outlook
TMC is a high-volatility bet on the future of energy resource sourcing.
While the technical setup is currently strong, it’s likely nearing exhaustion.
The next optimal entry will likely come after consolidation.
Monitor financial dilution risk and sustainability of momentum.
🧩 Deep-Dive Report (Flow + Sentiment)
- Strong institutional buying & 5x average volume
- Buzz rising on Reddit and retail platforms
- Short interest is high, but less threatening near term
- Analysts anticipate long-term resource shift
- Ideal strategy: wait for dips + manage risk on speculative trend
